
Foundation June 2017 Paper 2 Q3
3 A teacher asks the students in Year 6 what type of transport they use to get to school.
The dual bar chart shows some of the results.
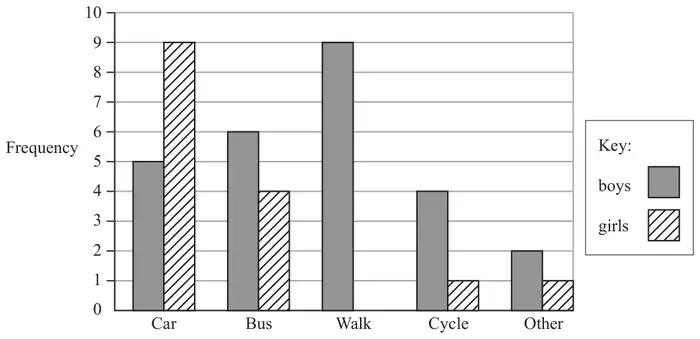
(a) What is the most popular type of transport used by the boys? (1)
7 girls walk to school.
(b) Show this information on the dual bar chart. (1)
More of the students get to school by car than by bus.
(c) How many more? (1)
The number of students in Year 5 is the same as the number of students in Year 6
(d) What is the total number of students in Years 5 and 6? (2)
| Answer | Mark | Notes |
|---|---|---|
| Walk | B1 | cao |
| Answer | Mark | Notes |
|---|---|---|
| 7 on chart | B1 | for bar of height 7 drawn for girls walking |
| Answer | Mark | Notes |
|---|---|---|
| 4 | B1 | cao |
| Answer | Mark | Notes |
|---|---|---|
| 96 | M1 | for method to find number of Year 6 students in the survey e.g. \(5 + 9 + 6 + 4 + 9 + 7 + 4 + 1 + 2 + 1\ (= 48)\) or \(14 + 10 + 16 + 5 + 3\ (= 48)\) |
| A1 | for 96 or ft from (b), eg 82 if no bar in (b) |