
June 2025 Statistics Q2
2. Jasper is investigating the relationship between Daily Mean Pressure and Daily Mean Windspeed (Beaufort conversion) for Perth in 2015 using the data from the large data set.
Treating the large data set for Perth in 2015 as the population, Jasper decides to use all the data available.
All of the Daily Mean Windspeed data for Perth in 2015 are classed as either “Light” or “Moderate”.
Jasper splits the data for Perth in 2015 into Light days and Moderate days and draws a box plot for each set of data, but omits the lower tail for Light days.
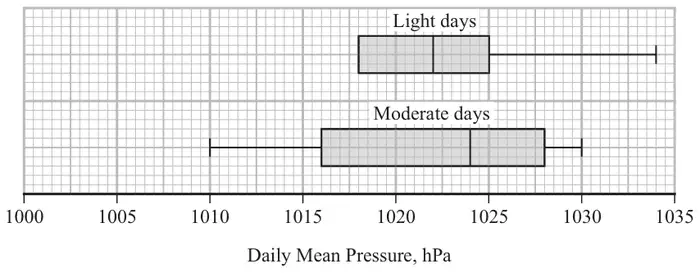
The smallest three values of Daily Mean Pressure for Light days for Perth in 2015 are 1007, 1009 and 1010 hPa.
An outlier in the first quartile is defined as any value more than \(1.5 \times \text{IQR}\) below \(\mathrm{Q}_1\)
The box plot for Light days is based on data for 161 days.
| Scheme | Marks | AO |
|---|---|---|
| Census | B1 | 1.2 |
| (1) |
Notes
B1: cao
| Scheme | Marks | AO |
|---|---|---|
| \(1018 - (1025 - 1018) \times 1.5\ (= 1007.5)\) | M1 | 2.1 |
| \((1007 \lt 1007.5)\) There is one outlier/1007 is an outlier | A1 | 1.1b |
| (2) |
Notes
M1: finding the correct IQR for “light days” and using it to calculate the lower outlier limit (implied by a correct lower limit 1007.5)
A1: correct outlier limit with correct conclusion
Note: 1007 on its own with no supporting working is M0A0.
| Scheme | Marks | AO |
|---|---|---|
| Lower whisker drawn to 1009 and a single outlier at 1007 | B1ft | 2.2a |
| Allow lower whisker to end at 1007.5 or 1009 | ||
| (1) |
Notes
B1ft: correct lower whisker drawn to 1009 and single outlier marked at 1007
or correct ft their conclusion to part (b)(i) i.e. if they state there are no outliers, then the lower whisker must be drawn to 1007
| Scheme | Marks | AO |
|---|---|---|
| \(184 - 161 = 23\) days with “Moderate” Windspeed | M1 | 2.4 |
| \(23 \times 0.25 = 5.75\), so 6 days. | A1 | 2.2b LDS |
| (2) | ||
| (6 marks) |
Notes
M1: using knowledge of LDS to find the number of days with “Moderate” Windspeed. Allow use of 180 to 185.
Implied by an answer of 5.75 or 19 to 24 from correct knowledge of LDS
A1: allow 5 or 6 days Correct answer only M1A1.