
June 2024 Statistics Q3
3. Customers in a shop have to queue to pay.
The partially completed table and partially completed histogram below, give information about the time, \(x\) minutes, spent in the queue by each of 112 customers one day.
| Time in queue (\(x\) minutes) | Frequency |
|---|---|
| 1–2 | 64 |
| 2–3 | |
| 3–4 | 13 |
| 4–6 | |
| 6–8 | 3 |
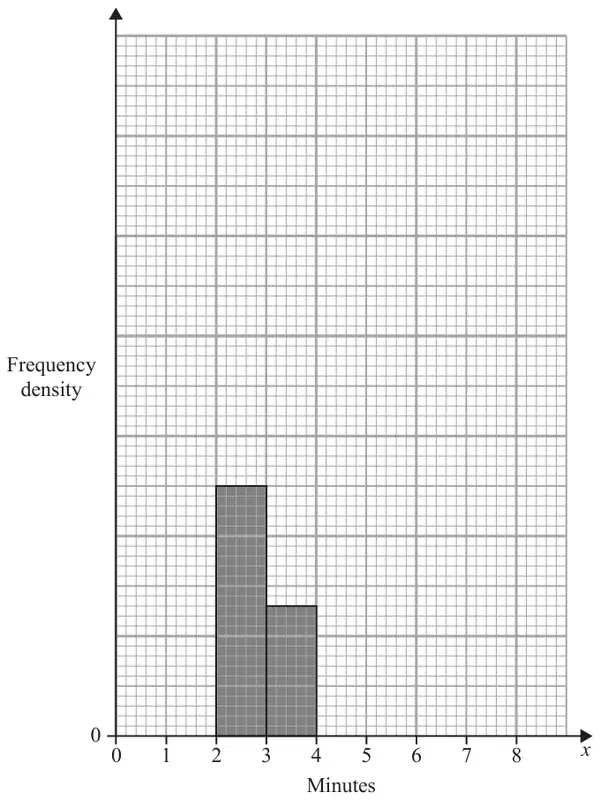
No customer spent less than 1 minute or longer than 8 minutes in the queue.
Ting decides to model the frequency density for these 112 customers by a curve with equation\[y = \frac{k}{x^2} \qquad 1 \leqslant x \leqslant 8\]where \(k\) is a constant.
| Scheme | Marks | AO |
|---|---|---|
| [From 3~4 bar and freq in table deduce] fd scale of 1cm = 5 | M1 | 2.2a |
| 2~3 has freq = 25 and 4~6 has freq = 112 – (64+13+3 + “25”) = 7 | A1 | 1.1b |
| (2) |
Notes
M1 for deducing a correct fd scale (seen on graph or in text) may be implied 25 or 7
if 25 or 7 found, then ignore their fd scale
A1 for both 25 and 7
| Scheme | Marks | AO |
|---|---|---|
| For a bar between 4~6 of height \(\tfrac{\text{``}7\text{''}}{2} = 3.5\) small squares or For a bar between 6~8 of height 1.5 small squares | M1 | 2.2a |
| For a fully correct histogram with all 3 bars plotted correctly | A1ft | 1.1b |
| (2) |
Notes
Ignore their fd scale in part (b)
M1 for a correct bar over 4~6 follow through their “7” from their table
or for a correct bar over 6~8
A1ft for a fully correct histogram (all 3 bars correct height and correct width)
allow ft on their 4~6 bar
| Scheme | Marks | AO |
|---|---|---|
| Require \(\displaystyle\int_{(1)}^{(8)} \frac{k}{x^2}\,\mathrm{d}x = 112\) | M1 | 3.4 |
| \(\displaystyle = \left[\frac{-k}{x}\right]_1^8 = \left(-\frac{k}{8}\right) - \left(-\frac{k}{1}\right)[= 112]\) | M1 | 1.1b |
| i.e. \(\left[\dfrac{7}{8}k = 112 \Rightarrow\right]\) \(k =\) 128 | A1 | 1.1b |
| (3) | ||
| (7 marks) |
Notes
1st M1 for correct integral expression = 112 (condone missing d\(x\) and ignore limits)
or attempt to integrate (\(x^{-2} \to x^{-1}\)) and set area = 112 (ignore limits)
2nd M1 for correct integration and some use of limits of 1 and 8 (condone missing 112)
\(\dfrac{7}{8}k = 112\) implies M1M1
A1 for 128