
June 2025 Paper 1 Q7
7.
A company makes a particular type of chair.
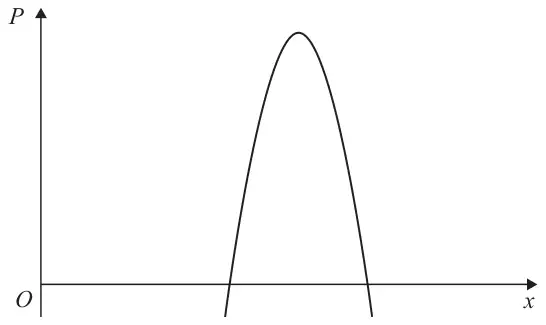
The annual profit made by the company is modelled by the equation\[P = -x^2 + 260x - 16\,450\]where \(P\) is the profit measured in thousands of pounds and \(x\) is the selling price of the chair in pounds.
The graph of \(P\) against \(x\) is shown in Figure 3.
Using the model,
Given that the company made an annual profit of more than £200 000
You must show your working clearly. (3)
The company wishes to maximise its annual profit.
State, according to the model,
| Scheme | Marks | AO |
|---|---|---|
| \(P = -175^2 + 260 \times 175 - 16\,450\) | M1 | 3.4 |
| \(= -1575\ \therefore\) not sensible as the company would make a loss | A1 | 2.4 |
| (2) |
Notes
Look for answers written in the question or on Figure 3
M1: Substitutes \(x = 175\) into \(P = -x^2 + 260x - 16\,450\) to find a value for \(P\).
This is implied by an answer of \(-1575\).
Alternatively attempts to find the solutions of \(-x^2 + 260x - 16\,450 = 0\) usual rules apply so a method must be seen or the correct roots stated (these are 108.78… and 151.21…) and compares with 175 which may be implied.
A1: Finds \(P = -1575\) and states that \(P \lt 0\) which may be implied and explains that the company would make a loss/negative profit, the profit is negative, the company will not make any money.
Condone suggestions that the loss is £1575 rather than £1 575 000
or obtains the larger root as awrt 151, compares 175 > 151 and states that \(P \lt 0\) which may be implied and explains that the company would make a loss/would not make a profit.
Explanations that are incomplete or incorrect score A0 e.g.
- the profit cannot be negative (because it can)
- they might make a loss (because they will make a loss)
- it is negative (without saying what it is)
You may ignore any misconceptions or reference to the price of the chair being too cheap for this mark.
Attempts to find the turning point score no marks unless there is some consideration of the profit when \(x = 175\)
| Scheme | Marks | AO |
|---|---|---|
| \(-x^2 + 260x - 16\,450 = 200\) \(\Rightarrow x^2 - 260x + 16\,650 = 0 \Rightarrow x = \ldots\) | M1 | 3.1b |
| \((114.19 \lt)\ x \lt 145.81\) | dM1 | 1.1b |
| Maximum Price = £145.81 | A1 | 3.2a |
| (3) |
Notes
Look for answers written in the question or on Figure 3
M1: Uses \(P \ldots 200\) where … is any inequality or = with \(P = -x^2 + 260x - 16\,450\) and proceeds to at least one value for \(x\) via a correct method which may be via calculator (you may need to check) and may be inexact.
dM1: Award for solving to find two positive values for \(x\). Allow decimal answers or surds.
FYI correct answers are \(\dfrac{260 \pm \sqrt{1000}}{2}\) or \(130 \pm 5\sqrt{10}\) or 114/146
or if only one value of \(x\) is seen, this must be the higher value for their quadratic which must have 2 positive solutions (you may need to check).
e.g. for the correct quadratic \(130 + 5\sqrt{10}\) or 145.81/145.82/145.8/146
A1: Deduces that the maximum price is £145.81 with units. Allow £145.81p
£145.82 is not acceptable and if both values are given score A0.
There must be some evidence of the correct equation being solved but condone incorrect inequalities appearing in their working.
Note: Missing units from an otherwise correct answer should only be penalised once in (b) or (d) and penalise it the first time it occurs.
| Scheme | Marks | AO |
|---|---|---|
| \(-x^2 + 260x - 16\,450 = -(x \pm k)^2 \pm \ldots\) or \(b = -1\) | B1 | 1.1b |
| \(-x^2 + 260x - 16\,450 = -(x - 130)^2 \pm \ldots\) or \(b = -1\) and \(c = -130\) | M1 | 1.1b |
| \((P =)\ 450 - (x - 130)^2\) | A1 | 1.1b |
| (3) |
Notes
Look for answers written in the question or on Figure 3
Allow to score anywhere in the question.
Note that some candidates use \(200 = -x^2 + 260x - 16\,450\) in (c) and attempt to complete the square on this. In these cases allow the B mark and the M mark as defined below.
B1: Achieves \(-(x \pm k)^2 \pm \ldots\) or states that \(b = -1\)
M1: Achieves \(-(x - 130)^2 \pm \ldots\) or states \(b = -1\) and \(c = -130\)
A1: \(\{P =\}\ 450 - (x - 130)^2\) or e.g. \(\{P =\} -(x - 130)^2 + 450\) or e.g. \(\{P =\}\ 450 - 1(x - 130)^2\)
Must be simplified e.g. not \(\{P =\} -16\,450 + 16\,900 - (x - 130)^2\)
Note that this may be done in a variety of ways including equating with the expanded form of \(a + b(x + c)^2 = bx^2 + 2bcx + bc^2 + a\)
Correct answer only scores full marks. If there is incorrect/muddled working, mark their final answer.
| Scheme | Marks | AO |
|---|---|---|
| (d)(i) States maximum profit = £450 000 | B1 | 3.2a |
| (ii) States selling price £130 | B1 | 2.2a |
| (2) | ||
| (10 marks) |
Notes
Look for answers written in the question or on Figure 3
If there is no labelling in (d), mark in the order presented.
(d)(i)
B1: Maximum profit = £450 000 with units. Accept 450 thousand pounds or £450k
This is an independent mark so could follow incorrect work in (c).
(d)(ii)
B1: Selling price = £130 with units.
This is an independent mark so could follow incorrect work in (c).
Note: Missing units from an otherwise correct answer should only be penalised once in (b) or (d) and penalise it the first time it occurs.