
October 2020 Paper 3 Q2
2. A random sample of 15 days is taken from the large data set for Perth in June and July 1987.
The scatter diagram in Figure 1 displays the values of two of the variables for these 15 days.
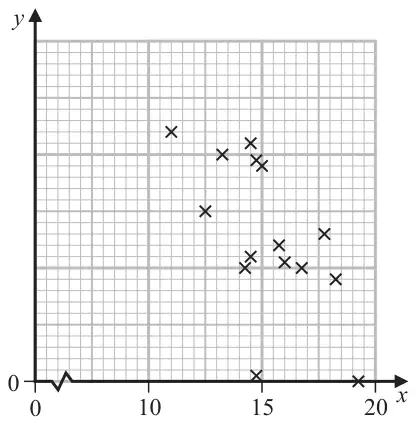
The variable on the \(x\)-axis is Daily Mean Temperature measured in °C.
Stav believes that there is a correlation between Daily Total Sunshine and Daily Maximum Relative Humidity at Heathrow.
He calculates the product moment correlation coefficient between these two variables for a random sample of 30 days and obtains \(r = -0.377\)
State clearly
- your hypotheses
- your critical value
On a random day at Heathrow the Daily Maximum Relative Humidity was 97%
| Scheme | Marks | AO |
|---|---|---|
| Negative | B1 | 1.2 |
| (1) |
Notes
B1: for stating negative. “Negative skew” is B0 though
| Scheme | Marks | AO |
|---|---|---|
| (i) Rainfall or Pressure | B1 | 2.2b |
| (ii) mm or hPa or Pascals or hectopascals or mb or millibars | B1ft | 1.1b |
| (2) |
Notes
(b)(i) B1: for mentioning “rainfall” (allow “rain” or “precipitation”) or “pressure” (if more than 1 answer both must be correct)
NB the other quantitative variable for Perth is: Daily Mean Wind Speed and scores B0
[Not allowed “wind speed” since \(r = +0.15\) and in winter might expect wind to raise temp]
(ii) B1ft: for giving the correct units. If Daily Mean Wind Speed (kn) or knots
“Wind speed” and “knots” would score B0B1 but any other variable scores B0B0
| Scheme | Marks | AO |
|---|---|---|
| \(\mathrm{H}_0 : \rho = 0 \qquad \mathrm{H}_1 : \rho \neq 0\) | B1 | 2.5 |
| Critical value: \(-0.361(0)\) | M1 | 1.1b |
| \(r \lt -0.3610\) so significant result and there is evidence of a correlation between Daily Total Sunshine and Daily Maximum Relative Humidity | A1 | 2.2b |
| (3) |
Notes
B1: for both hypotheses correct in terms of \(\rho\)
M1: for the correct critical value compatible with their H1: allow \(\pm 0.361(0)\)
If the hypotheses are 1-tail then allow cv of \(\pm 0.3061\)
e.g. Alternative hypothesis with \(r \lt \pm 0.377\) implies a one-tail test or H0 and H1 in words saying “H0: there is no correlation, H1: there is correlation” is two-tail
If there are no hypotheses (or they are nonsensical) assume 2-tail so M1 for \(\pm 0.361(0)\)
A1: for a correct conclusion in context based on comparing \(-0.377\) with their cv.
Condone incorrect inequality e.g. \(-0.3610 \lt -0.377\) as long as they reject H0
Do not accept contradictory statements such as “accept H0 so there is evidence of …”
Can say “support for Stav’s belief”(o.e.e.g. “claim”) or “evidence of a correlation between sunshine and humidity” condone “negative correlation” or comments such as “if humidity is high amount of sunshine will be low”
| Scheme | Marks | AO |
|---|---|---|
| Humidity is high and there is evidence of correlation and \(r \lt 0\) So expect amount of sunshine to be lower than the average for Heathrow(oe) | B1 | 2.2b |
| (1) | ||
| (7 marks) |
Notes
B1: for stating low amount of sunshine (o. e.) and some reference to \(r \lt 0\) or fog
Check for the following 2 features:
(i) low sunshine: allow \(\leqslant 5\) hrs (LDS mean for 2015 is 5.3, humidity 97% is 4.1, \(\geqslant 97\)% is 3.1)
(ii) negative correlation may be described in words e.g. “high humidity gives low sunshine” or fog (LDS says >95% humidity is foggy) so less sunshine