
June 2023 Paper 3 Q6
6. A medical researcher is studying the number of hours, \(T\), a patient stays in hospital following a particular operation.
The histogram below summarises the results for a random sample of 90 patients.
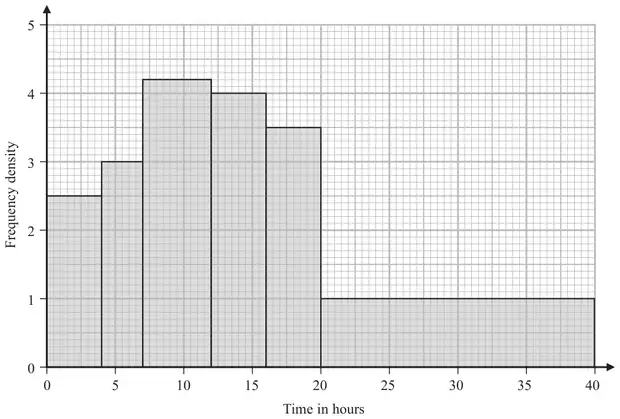
For these 90 patients the time spent in hospital following the operation had
- a mean of 14.9 hours
- a standard deviation of 9.3 hours
Tomas suggests that \(T\) can be modelled by \(\mathrm{N}(14.9,\ 9.3^2)\)
Xiang suggests that the frequency polygon based on this histogram could be modelled by a curve with equation
\[y = kx\mathrm{e}^{-x} \qquad 0 \leqslant x \leqslant 4\]where
- \(x\) is measured in tens of hours
- \(k\) is a constant
The researcher decides to use Xiang’s curve to model \(\mathrm{P}(a \lt T \lt b)\)
| Scheme | Marks | AO |
|---|---|---|
| \(2 \times 4.2,\ 4 \times 4,\ 4 \times 3.5,\ 10 \times 1 \quad (= 8.4 + 16 + 14 + 10 = 48.4)\) | M1 | 1.1b |
| [So \(\mathrm{P}(10 \lt T \lt 30) =\)] \(\left[\dfrac{48.4}{90}\right] = \dfrac{121}{225} = 0.53777\ldots\) 0.53~0.54 (2sf OK) | A1 | 1.1b |
| (2) |
Notes
M1: for an attempt to find the number between 10 and 30 ( 2 correct products or 48 or 48.4 seen)
A1: for 2sf answer in [0.53 ~ 0.54] NB use of 48 gives 0.5333… [Correct ans implies 2/2]
| Scheme | Marks | AO |
|---|---|---|
| (Not suitable as) data is not symmetric or is skew (normal is symmetric) (“Even” distribution or a diagram on its own is not enough so B0) | B1 | 2.4 |
| (1) |
Notes
B1: for a comment suggesting not suitable based on (lack of) symmetry or “not bell shaped”
| Scheme | Marks | AO |
|---|---|---|
| \(\displaystyle\int x\mathrm{e}^{-x}\ (\mathrm{d}x) = \int x\,\mathrm{d}(-\mathrm{e}^{-x})\) | M1 | 2.1 |
| \(\displaystyle = \left[-x\mathrm{e}^{-x}\right] - \int \left(-\mathrm{e}^{-x}\right)(\mathrm{d}x) \quad (+c)\) | A1 | 1.1b |
| \(\displaystyle\int_0^n x\mathrm{e}^{-x}\ (\mathrm{d}x) = \left[-x\mathrm{e}^{-x} - \mathrm{e}^{-x}\right]_0^n = \left(-n\mathrm{e}^{-n} - \mathrm{e}^{-n}\right) - \left[-(0) - 1\right]\) | dM1 | 1.1b |
| \(= \underline{1 - (n + 1)\mathrm{e}^{-n}}\) (*) | A1cso* | 1.1b |
| (4) |
Notes
1st M1: for attempting integration by parts in right direction. Must have \(u = x\) and \(v = \pm\,\mathrm{e}^{-x}\)
1st A1: for a correct first step, correct first integration and expression for second integral
2nd dM1: (dep on 1st M1) for all integration attempted and some use of at least one limit
* 2nd A1: for cso with no incorrect working seen. Minimum is correct int and use of limits seen.
| Scheme | Marks | AO |
|---|---|---|
| Require area = 90 i.e. \(\displaystyle k\int_{(0)}^{(n)} x\mathrm{e}^{-x}\,\mathrm{d}x = 90\) (ignore limits) | M1 | 3.1a |
| Using the result in part (c) with \(n = 4\) gives \(k\left[1 - 5\mathrm{e}^{-4}\right] = 90\) | M1 | 2.1 |
| (\(k =\)) 99(.0729…) (*) | A1cso* | 1.1b |
| (3) |
Notes
1st M1: for realising need area under the curve (implied by the integral) = 90
2nd M1: for use of (c) with \(n = 4\) and set = 90 May be implied by sight of 99.07… or better
* A1cso: for \(k = 99\) or awrt 99.1
NB: Allow use of \(k = 99\) and show area = awrt 89.9 with a conclusion to score 3/3
| Scheme | Marks | AO |
|---|---|---|
| (i) [\(\mathrm{P}(10 \lt T \lt 30) =\)] 0.64863… awrt 0.649 | B1 | 1.1b |
| (1) | ||
| (ii) [No. of patients =] \((99)\left[\left(1 - 4\mathrm{e}^{-3}\right) - \left(1 - 2\mathrm{e}^{-1}\right)\right] \quad (= 53.1..)\) | M1 | 3.4 |
| Prob \(= \dfrac{0.5366\ldots \times 99}{90} = 0.59027\ldots\) [or 0.5907…] = awrt 0.590 or 0.591 | A1 | 3.2a |
| (2) |
Notes
(e)(i) B1: for awrt 0.649
(ii) M1: for use of (c) with \(n = 1\) and \(n = 3\) Don’t need the 99. Implied by sight of awrt 0.54
A1: for awrt 0.590 or awrt 0.591 Allow 0.59 from correct working seen.
| Scheme | Marks | AO |
|---|---|---|
| eg Patients might stay longer than 40 hours (Can ignore other comments unless clearly contradictory.) | B1 | 3.5b |
| (1) | ||
| (14 marks) |
Notes
B1: eg for comment, in context, about the upper limit for time (\(t\) or \(x\))(time/hour may be implied)