
October 2020 Paper 2 Q12
12.
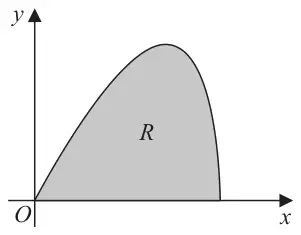
The curve shown in Figure 3 has parametric equations\[x = 6\sin t \qquad y = 5\sin 2t \qquad 0 \leqslant t \leqslant \frac{\pi}{2}\]
The region \(R\), shown shaded in Figure 3, is bounded by the curve and the \(x\)-axis.
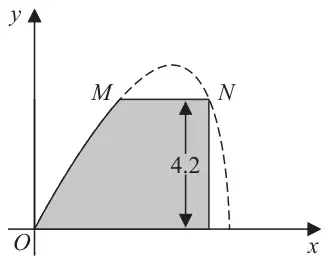
Part of the curve is used to model the profile of a small dam, shown shaded in Figure 4.
Using the model and given that
- \(x\) and \(y\) are in metres
- the vertical wall of the dam is 4.2 metres high
- there is a horizontal walkway of width \(MN\) along the top of the dam
| Scheme | Marks | AO |
|---|---|---|
| \(y \times \dfrac{\mathrm{d}x}{\mathrm{d}t} = 5\sin 2t \times 6\cos t\) or \(5 \times 2\sin t\cos t \times 6\cos t\) | M1 | 1.2 |
| (Area =) \(\displaystyle\int 5\sin 2t \times 6\cos t\,\mathrm{d}t = \int 5 \times 2\sin t\cos t \times 6\cos t\,\mathrm{d}t\) or \(\displaystyle\int 5\sin 2t \times 6\cos t\,\mathrm{d}t = \int 60\sin t\cos^2 t\,\mathrm{d}t\) | dM1 | 1.1b |
| (Area =) \(\displaystyle\int_0^{\frac{\pi}{2}} 60\sin t\cos^2 t\,\mathrm{d}t\) * | A1* | 2.1* |
| (3) |
Notes
M1: Attempts to multiply \(y\) by \(\dfrac{\mathrm{d}x}{\mathrm{d}t}\) to obtain \(A\sin 2t\cos t\) but may apply \(\sin 2t = 2\sin t\cos t\) here
dM1: Attempts to use \(\sin 2t = 2\sin t\cos t\) within an integral which may be implied by e.g. \(\displaystyle A\int \sin 2t \times \cos t\,\mathrm{d}t = \int k\sin t\cos^2 t\,\mathrm{d}t\)
A1*: Fully correct work leading to the given answer.
This must include \(\sin 2t = 2\sin t\cos t\) or e.g. \(5\sin 2t = 10\sin t\cos t\) seen explicitly in their proof and a correct intermediate line that includes an integral sign and the “d\(t\)”
Allow the limits to just “appear” in the final answer e.g. working need not be shown for the limits.
| Scheme | Marks | AO |
|---|---|---|
| \(\displaystyle\int 60\sin t\cos^2 t\,\mathrm{d}t = -20\cos^3 t\) | M1 A1 | 1.1b 1.1b |
| Area \(= \left[-20\cos^3 t\right]_0^{\frac{\pi}{2}} = 0 - (-20) = 20\) * | A1* | 2.1 |
| (3) |
Notes
M1: Obtains \(\displaystyle\int 60\sin t\cos^2 t\,\mathrm{d}t = k\cos^3 t\). This may be attempted via a substitution of \(u = \cos t\) to obtain \(\displaystyle\int 60\sin t\cos^2 t\,\mathrm{d}t = ku^3\)
A1: Correct integration \(-20\cos^3 t\) or equivalent e.g. \(-20u^3\)
A1*: Rigorous proof with all aspects correct including the correct limits and the \(0 - (-20)\) and not just: \(-20\cos^3\dfrac{\pi}{2} - (-20\cos^3 0) = 20\)
| Scheme | Marks | AO |
|---|---|---|
| \(5\sin 2t = 4.2 \Rightarrow \sin 2t = \dfrac{4.2}{5}\) | M1 | 3.4 |
| \(t = 0.4986\ldots, 1.072\ldots\) | A1 | 1.1b |
| Attempts to finds the \(x\) values at both \(t\) values | dM1 | 3.4 |
| \(t = 0.4986\ldots \Rightarrow x = 2.869\ldots\) \(t = 1.072 \Rightarrow x = 5.269\ldots\) | A1 | 1.1b |
| Width of path = 2.40 metres | A1 | 3.2a |
| (5) | ||
| (11 marks) |
Notes
M1: Uses the given model and attempts to find value(s) of \(t\) when \(\sin 2t = \dfrac{4.2}{5}\). Look for \(2t = \sin^{-1}\dfrac{4.2}{5} \Rightarrow t = \ldots\)
A1: At least one correct value for \(t\), correct to 2 dp. FYI \(t = 0.4986\ldots, 1.072\ldots\) or in degrees \(t = 28.57\ldots, 61.42\ldots\)
dM1: Attempts to find TWO distinct values of \(x\) when \(\sin 2t = \dfrac{4.2}{5}\). Condone poor trig work and allow this mark if 2 values of \(x\) are attempted from 2 values of \(t\).
A1: Both values correct to 2 dp. NB \(x = 2.869\ldots,\ 5.269\ldots\)
Or may take Cartesian approach
\(5\sin 2t = 4.2 \Rightarrow 10\sin t\cos t = 4.2 \Rightarrow 10\dfrac{x}{6}\sqrt{1 - \dfrac{x^2}{36}} = 4.2 \Rightarrow x^4 - 36x^2 + 228.6144 = 0 \Rightarrow x = 2.869\ldots, 5.269\ldots\)
M1: For converting to Cartesian form A1: Correct quartic M1: Solves quartic A1: Correct values
A1: 2.40 metres or 240 cm
Allow awrt 2.40 m or allow 2.4m (not awrt 2.4 m) and allow awrt 240 cm. Units are required.