June 2022 Paper 1 Q4
4 The graph of
\[y = \mathrm{f}(x)\]where
\[\mathrm{f}(x) = ax^2 + bx + c\]is shown in Figure 1.
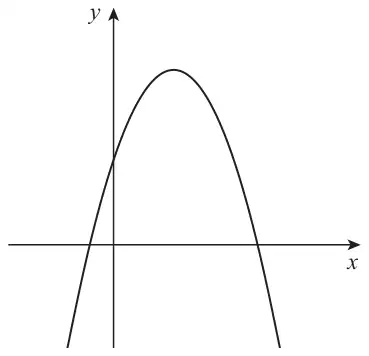
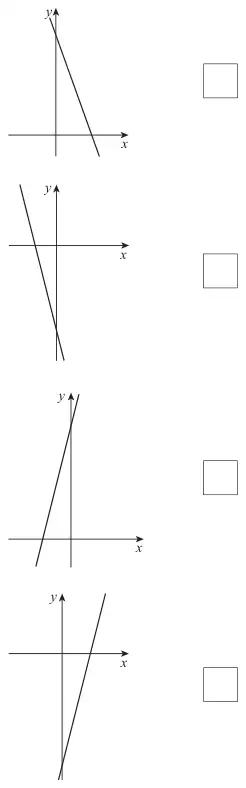
Which of the following shows the graph of \(y = \mathrm{f}^{\prime}(x)\)?
Tick (✓) one box. [1 mark]
| Scheme | Marks | AO |
|---|---|---|
| Ticks the correct box | R1 | 2.2a |
| (1 mark) |
Typical solution
The 1st (top) graph: a line with negative gradient, positive \(y\)-intercept, crossing the positive \(x\)-axis.