(b) Explain how you know that T cannot be Eulerian. (1)
(c)
(i) Determine the value of \(x\)
(ii) Hence state whether T is semi-Eulerian or not. You must justify your answer. (5)
Figure 2
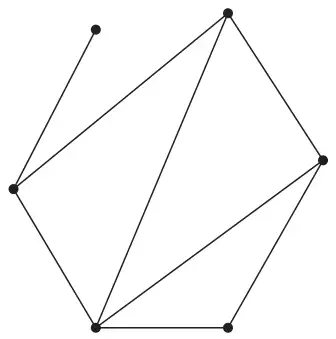
Figure 2 shows a graph, G, with six nodes with degrees 1, 2, 3, 3, 3 and 4
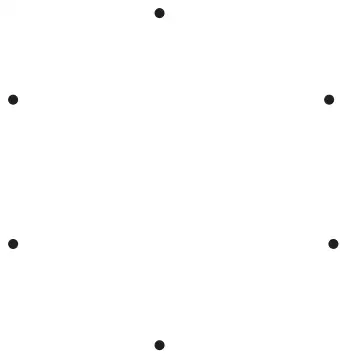
(d) Using the vertices in Diagram 1 in the answer book, draw a graph with exactly six nodes with degrees 1, 2, 3, 3, 3 and 4 that is not isomorphic to G. (1)
Diagram 1
Mark scheme (a)
Scheme
Marks
AO
e.g. A graph cannot contain an odd number of odd vertices e.g. \(\dfrac{1+2+3+4+5+6}{2} = 10.5\) which is not an integer and so therefore not possible to have a graph with the given vertex orders
B1
1.2
(1)
Notes
(a) In a and b condone poor language such as number of odd degrees instead of number of odd nodes
B1: CAO – common examples that score B1:
Cannot have (a graph with an) odd number of odd vertices
Cannot have a graph with three odd vertices
The sum of the degrees/order (of the vertices) is 21 which is not even therefore not possible (but not just for obtaining 21 and saying ‘impossible’). The 21 must be linked either in words to the ‘sum of the degrees/order’ or explicitly showing 1+ 2 + 3 + 4 + 5 + 6 = 21 so just ’21 is not even’ scores B0
The sum of the degrees/order (of the vertices) is 21 which is odd therefore not possible (with equivalent justification of the 21 as in the previous bullet-point)
\(\dfrac{1+2+3+4+5+6}{2} = 10.5\) which is not an integer so therefore impossible. They do not have to explain that they are using the result that \(\sum \text{vertex degrees} = 2(\text{no of arcs})\) but they must explain why a value of 10.5 leads to the required graph not being possible. A value of 10.5 with no working (or explanation) scores B0
Mark scheme (b)
Scheme
Marks
AO
e.g. T has at least one node of degree one or one node with odd degree
B1
2.4
(1)
Notes
(b) B1: CAO – correct reasoning that not all the vertices of T can have an even degree. Allow for this mark a general statement that no tree can be Eulerian as all trees contain at least two nodes of degree 1. Allow as a minimum statement that at least one of the nodes has a degree of 1 or at least one odd node (accept valency instead of degree or order)
Alternatively \(\begin{array}{llll} 4 - x \gt 0 & \Rightarrow\ x \lt 4 \qquad & 4 - x \geqslant 1 & \Rightarrow\ x \leqslant 3 \\ 2x - 5 \gt 0 & \Rightarrow\ x \gt 2.5 & 4x - 11 \geqslant 1 & \Rightarrow\ x \geqslant 3 \\ 2.5 \lt x \lt 4 & \Rightarrow\ x = 3 & & \phantom{\Rightarrow\ } x = 3 \end{array}\)
Therefore, the degrees of the nodes are 1, 2, 1, 1, 1 and 4
M1
2.1
T is not semi-Eulerian as there are more than two nodes of odd degree
A1
2.2a
(5)
Notes
B1: correctly using the fact that the number of arcs in T is 5 (possibly implied by later working – e.g. forming an equation for the sum of nodes = 2 x 5) An answer of \(x = 3\) from correct working implies this mark.
Alternative approach either \(4 - x \gt 0 \;\Rightarrow\; x \lt 4\) or \(2x - 5 \gt 0 \;\Rightarrow\; x \gt 2.5\) May use \(4x - 11 \geqslant 1 \;\Rightarrow\; x \geqslant 3\)
M1: Forming an equation involving the degree of the six nodes and 2(5).
Alternative approach both inequalities stated and combined to obtain range of values for \(x\)
A1: CAO (\(x = 3\)) – must come from correct working
M1: Calculating the degree of the remaining vertices using their value of \(x\). As a minimum we must see correct values for at least two more odd nodes. Must have an integer value for \(x\) (this can be implied by sight of 1, 2, 1, 1, 1, 4) Alternatively may clearly use \(x = 3\) is odd and deduce that there are at least three odd nodes
A1: CAO (not Semi-Eulerian) – with correct reasoning
Mark scheme (d)
Scheme
Marks
AO
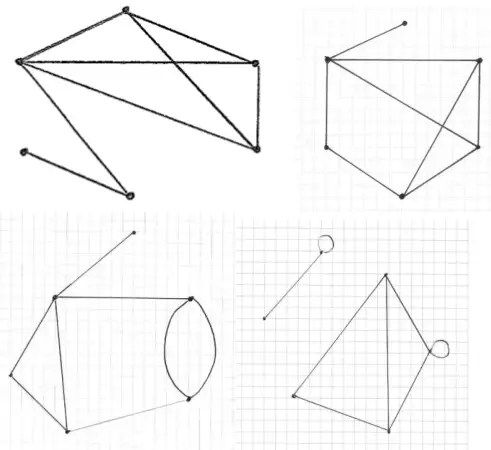
e.g.
B1
1.1b
(1)
(8 marks)
Notes
B1: CAO (any graph that is not isomorphic to G – must contain exactly 8 arcs) If a simple, connected graph the vertex with degree 1 must connect to either the vertex of degree 2 or degree 4. Note this does not have to be a simple graph and may not be connected (Degrees are 1, 2, 3, 3, 3, 4)
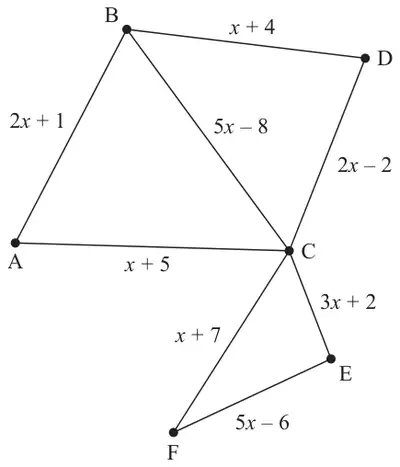
Figure 4 shows a graph G that contains 8 arcs and 6 vertices.
(a) State the minimum number of arcs that would need to be added to make G into an Eulerian graph. (1)
(b) Explain whether or not the route A – C – F – E – C – D – B is an example of a path on G. (1)
Figure 4 represents a network of 8 roads in a city. The expression on each arc gives the time, in minutes, to travel along the corresponding road.
You are given that \(x \gt 1.6\)
A route is required that
starts and finishes at the same vertex
traverses each road at least once
minimises the total time taken
The route inspection algorithm is applied to the network in Figure 4 and the time taken for the route is found to be at most 189 minutes.
Given that the inspection route contains two roads that need to be traversed twice,
(c) determine the range of possible values of \(x\), making your reasoning clear. (6)
Mark scheme (a)
Scheme
Marks
AO
1
B1
1.2
(1)
Notes
(a) B1: cao
Mark scheme (b)
Scheme
Marks
AO
The route is not an example of a path as vertex C appears twice
B1
2.4
(1)
Notes
(b) B1: No + correct reason – no bod – must refer to C appearing twice (not just that a vertex is repeated) or that it contains the cycle C – F – E – C (not just that it contains a cycle). All technical language must be correct if used for this mark and do not isw any incorrect reasoning (for example if they imply that a path must pass through every vertex)
Mark scheme (c)
Scheme
Marks
AO
As the route contains two roads that need to be traversed twice this means that either the pairing AB, AC or BD, CD needs to be repeated
B1
2.1
AB + AC = \(3x + 6\) and BD + CD = \(3x + 2\) and as \(3x + 6 \gt 3x + 2\) (for all values of \(x\)) this means that BD + CD are repeated
B1
2.2a
Because two roads are repeated in the shortest inspection route this means that \(5x - 8 \gt 3x + 2\)
M1
3.1b
\(x \gt 5\)
A1
1.1b
\((20x + 3) + (3x + 2) \leqslant 189\)
M1
3.4
\(x \leqslant 8\)
A1
2.2a
(6)
(8 marks)
Notes
(c) B1: Recognising that one of the two pairings between B and C containing two arcs will need to be repeated. For example, might state BAC or BDC or BA, AC or BD, DC (as an indication of considering the two odd nodes B and C together with one of the two paths via A and D) orone of the expressions \(3x + 6\) or \(3x + 2\) (or correct but unsimplified) seen would score this mark. Condone for this mark those candidates who consider the direct arc BC (provided at least one of the pairings via A or D is considered too)
B1: Correct deduction that BD + CD needs to be repeated (or that AB + AC is not repeated). Allow stating that \(3x + 2\) is ‘better’ than \(3x + 6\) or simply stating both expressions and selecting \(3x + 2\) (but we must see both simplified expressions for this mark). This selection of \(3x + 2\) (after seeing both expressions) could be implied by forming an equation/inequality with only this expression. This mark cannot be awarded if either of the other two inequalities/equations e.g. \((20x + 3) + (3x + 6) \leqslant 189\) or \((20x + 3) + (5x - 8) \leqslant 189\) are formed, unless they are explicitly rejected with the correct reason (that is because \(3x + 6 \gt 3x + 2\) and because the route contains two roads). Obtaining \(x \leqslant 7.826\ldots\) and/or \(x \leqslant 7.76\) and simply rejecting these without the valid reasons as stated above does not score this mark
M1: Considers explicitly the direct route between B and C (\(5x - 8\)) and compares this (in the form of a linear equation or inequality) with either of the two pairings AB + AC or BD + CD
A1: cao (\(x \gt 5\))
M1: (\(20x + 3\)) + (either their \(3x + 6\) or their \(3x + 2\)) together with 189 (allow equals or any inequality)
A1: cao (\(x \leqslant 8\))
If full marks would have been awarded in (c) but any other inequalities apart from \(x \gt 5\) and \(x \leqslant 8\) are found, then withhold the second B mark
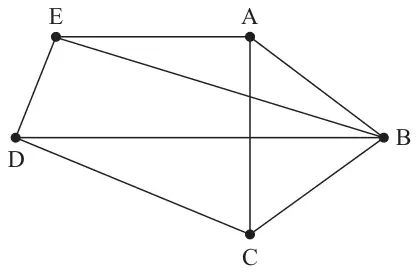
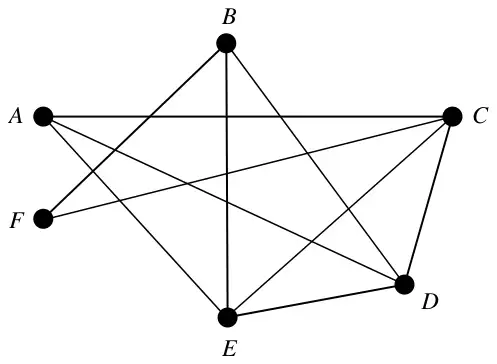
(a) State whether G is Eulerian, semi-Eulerian, or neither, giving a reason for your answer. (1)
(b) Write down an example of a Hamiltonian cycle on G. (1)
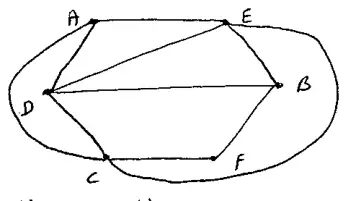
(c) State whether or not G is planar, justifying your answer. (1)
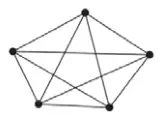
(d) State the number of arcs that would need to be added to G to make the graph \(K_5\) (1)
Figure 2
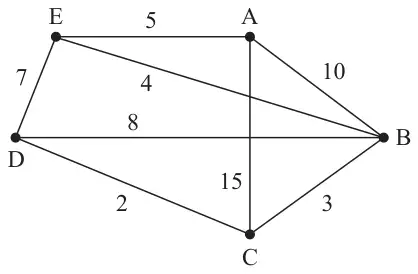
Direct roads between five villages, A, B, C, D and E, are represented in Figure 2. The weight on each arc is the time, in minutes, required to travel along the corresponding road. Floyd’s algorithm is to be used to find the complete network of shortest times between the five villages.
(e) For the network represented in Figure 2, complete the initial time matrix in the answer book. (1)
Initial time matrix (answer book)
A
B
C
D
E
A
–
B
–
C
–
D
–
E
–
The time matrix after four iterations of Floyd’s algorithm is shown in Table 1.
A
B
C
D
E
A
–
10
13
15
5
B
10
–
3
5
4
C
13
3
–
2
7
D
15
5
2
–
7
E
5
4
7
7
–
Table 1
(f) Perform the final iteration of Floyd’s algorithm that follows from Table 1, showing the time matrix for this iteration. (2)
Mark scheme (a)
Scheme
Marks
AO
Graph G is neither as there are more than two vertices of odd degree
B1
2.4
(1)
Notes
B1: ‘Neither’ together with a correct reason (ignore irrelevant statements but do not isw incorrect statements)
Examples of B1:
G contains more than 2 odd nodes
G contains 4 odd nodes (or stating that A, C, D and E are odd)
G contains (only) 1 even node
The number of odd degree nodes in G is not 0 or 2
Examples of B0
G contains odd nodes
G contains at least 2 odd nodes
G contains 4 nodes of degree 3 (not linking this to ‘odd’)
Mark scheme (b)
Scheme
Marks
AO
e.g. A – B – C – D – E – A
B1
1.1b
(1)
Notes
B1: CAO - must begin and end at the same node and include every other node in the graph exactly once. Accept if given in terms of arcs e.g. AC, CB, BD, DE, EA
Mark scheme (c)
Scheme
Marks
AO
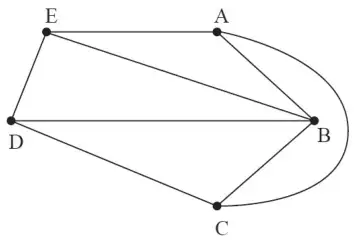
G is planar as it can be drawn with no arcs intersecting/crossing each other e.g.
B1
2.4
(1)
Notes
B1: Correct answer of planar + justification
Examples of correct justification:
AC can be moved outside or EB, DB can be moved outside
AC(O), BE(I), BD(I) (or vice-versa) accept just AC(O) or BE(O) and BD(O)
A correct drawing of the graph as planar (condone nodes not being labelled)
Examples of insufficient justification:
Move arc BE (or BD) outside (need to mention both)
Move arcs outside so that no arcs cross each other (must give specific examples of which arc(s) are being moved outside)
Comments about moving nodes
Mark scheme (d)
Scheme
Marks
AO
2
B1
1.1b
(1)
Notes
B1: CAO (2 only)
Mark scheme (e)
Scheme
Marks
AO
A
B
C
D
E
A
-
10
15
∞
5
B
10
-
3
8
4
C
15
3
-
2
∞
D
∞
8
2
-
7
E
5
4
∞
7
-
B1
1.1b
(1)
Notes
B1: CAO - no blanks entries (apart from the lead diagonal) and must include \(\infty\) in cells AD, CE, DA, EC)
Mark scheme (f)
Scheme
Marks
AO
A
B
C
D
E
A
-
[9]
[12]
[12]
5
B
[9]
-
3
5
4
C
[12]
3
-
2
7
D
[12]
5
2
-
7
E
5
4
7
7
-
M1 A1
1.1b 1.1b
(2)
(7 marks)
Notes
M1: No change in the fifth row and fifth column with at least two values reduced correctly (no blank entries – apart from the lead diagonal)
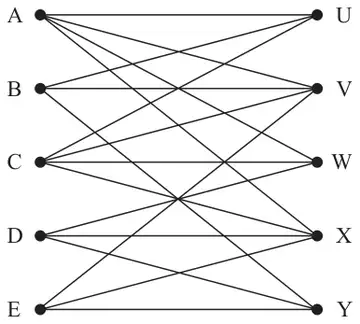
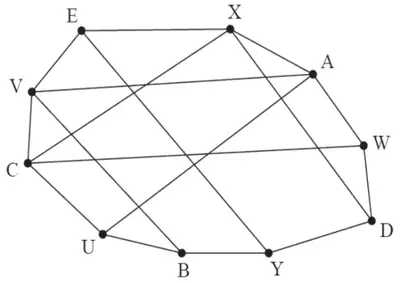
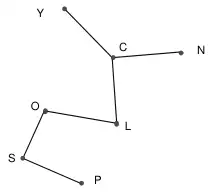
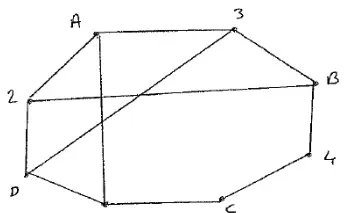
A Hamiltonian cycle for the graph in Figure 1 begins C, V, E, X, A, W, ….
(a) Complete the Hamiltonian cycle. (1)
(b) Hence use the planarity algorithm to determine whether the graph shown in Figure 1 is planar. You must make your working clear and justify your answer. (3)
Mark scheme (a)
Scheme
Marks
AO
…, D, Y, B, U, C
B1
1.1b
(1)
Notes
(a) B1: CAO (CVEXAWDYBUC) – must return to C
Mark scheme (b)
Scheme
Marks
AO
Or list of arcs: AU, AV, BV, CW, CX, DX, EY
M1
2.1
e.g., select (and label) AU (as I) and the arcs that intersect AU are BV, EY, CW and DX (so label them O so AU(I), AV, BV(O), CW(O), CX, DX(O), EY(O))
A1
1.1b
Edges BV and CW intersect and so the graph is not planar (oe)
A1
2.2a
(3)
(4 marks)
Notes
(b) M1: Either draws their Hamiltonian cycle from part (a) as the edges of a polygon and shows the remaining arcs intersecting inside OR lists the arcs that are not part of the Hamiltonian cycle
A1: Selects any arc (that is not part of the Hamiltonian cycle) and lists/references the correct arcs that intersect with this selected arc – dependent on any correct Hamiltonian cycle and correct arcs that are not part of this cycle
A1: cao – based on their initial arc selection, states the two arcs that are unlabelled (or that are labelled with the same label) which intersect each other (e.g., if CX chosen as the initial selection then this arc intersects with BV, EY and AV but EY and AV intersect) and concludes that the graph is not planar. This mark is dependent on the correct Hamiltonian cycle stated in either (a) or (b)
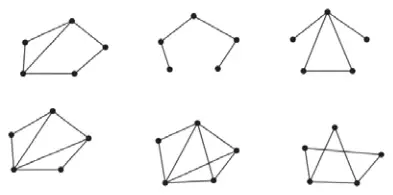
(i) In the context of graph theory explain what is meant by ‘semi-Eulerian’.
(ii) Draw two semi-Eulerian subgraphs of \(\text{K}_5\), each having five vertices but with a different number of edges. (3)
(c) Explain why a graph with exactly five vertices with vertex orders 1, 2, 2, 3 and 4 cannot be a tree. (2)
Mark scheme (a)
Scheme
Marks
AO
B1
1.2
(1)
Notes
B1: CAO (give bod for position of nodes)
Mark scheme (b)
Scheme
Marks
AO
(i) A semi-Eulerian graph contains exactlytwonodes of oddorder (and any number of nodes of even order)
B1
2.5
(ii) e.g. (two semi-Eulerian subgraphs of \(\text{K}_5\) with a different number of edges)
B1 B1
1.1b 1.1b
(3)
Notes
(b)(i) B1: CAO (accept ‘there are exactly two odd nodes’ but must contain exact oe (e.g. ‘only two odd nodes’ or ‘all but 2 nodes have an even order’ but not ‘the graph has two odd nodes’))
(b)(ii) B1: One correct semi-Eulerian subgraph of \(\text{K}_5\) with five nodes
B1: Two correct semi-Eulerian subgraphs of \(\text{K}_5\) with five nodes – note that the graphs must have a different number of edges
Mark scheme (c)
Scheme
Marks
AO
e.g. The graph with five vertices has \(\dfrac{1 + 2 + 2 + 3 + 4}{2} = 6\) arcs but a tree on five nodes would contain only 4 arcs
B1 B1dep
2.2a 2.4
(2)
(6 marks)
Notes
B1: Deducing that the graph has 6 arcs or a tree on five nodes has 4 arcs or the node of order 4 must be connected to the other 4 nodes or an argument based on the sum of the orders of both the graph and the tree (but must relate the orders to the number of arcs and not the number of nodes) or the node with order 4 and one of the nodes of orders 2 or 3 would create a cycle or a tree must have two nodes of order 1
B1dep: Complete argument – graph has 6 arcs and the tree would only have 4 arcs or the sum of the orders is 12 compared to 8 for the tree or the node of order 4 must be connected to the other 4 nodes therefore all the other vertices would have to have order 1 or the graph has 6 arcs and therefore with 5 vertices there would have to be cycles or the node of order 4 is connected to the other 4 nodes and so together with the node of order 3 (or 2) a cycle would be formed or a tree must have at least two nodes of order 1 as otherwise a cycle would be formed
Note: no marks in (c) for attempts based only on examples of graphs drawn with the vertex orders as stated
2. A simply connected graph is a connected graph in which any two vertices are directly connected by at most one arc and no vertex is directly connected to itself.
(a) Given that a simply connected graph has exactly four vertices,
(i) write down the minimum number of arcs it can have,
(ii) write down the maximum number of arcs it can have. (2)
(b)
(i) Draw a simply connected graph that has exactly four vertices and exactly five arcs.
(ii) State, with justification, whether your graph is Eulerian, semi-Eulerian or neither. (3)
(c) By considering the orders of the vertices, explain why there is only one simply connected graph with exactly four vertices and exactly five arcs. (5)
Mark scheme (a)
Scheme
Marks
AO
Minimum number of arcs is 3
B1
2.2a
Maximum number of arcs is 6
B1
2.2a
(2)
Notes
B1: Cao
B1: Cao
Mark scheme (b)
Scheme
Marks
AO
(i) e.g.
B1
1.1b
(ii) The graph has exactly two odd nodes and so the graph is semi-Eulerian
B1 DB1
2.4 2.2a
(3)
Notes
(b)(i) B1: Cao oe (vertices must be clear)
(b)(ii) B1: Explanation which consists of the graph having two odd nodes (or consistent explanation with their graph in (b)(i))
DB1:Exactly (or only) two odd nodes together with the deduction that therefore the graph is semi-Eulerian (from a correct graph only in (b)(i))
Mark scheme (c)
Scheme
Marks
AO
The sum of the orders of the vertices = 2(number of arcs) = 10
B1
1.2
One possibility is that the orders are 1, 3, 3 and 3
M1
2.1
In a simply connected graph with four vertices each of the vertices of order 3 must connect to the three other vertices therefore it is not possible to have three vertices all with order 3
A1
2.4
The second possibility is that the orders are 2, 2, 3 and 3
M1
2.1
There is only one way to make a graph with vertices of orders 2, 2, 3 and 3 as the two vertices of order 2 cannot be connected to each other (note that as the graph is connected no vertex can have order 0). There are no other possible graphs as the maximum order of a vertex is 3 (due to the condition that the graph must be simple)
A1
2.2a
(5)
(10 marks)
Notes
B1: 10 seen – this mark can be implied if two or more lists of four numbers which sum to 10 are seen
M1: States that the vertex orders could be 1, 3, 3, 3 or that no vertex can have an order greater than 3
A1: Convincing argument that 1, 3, 3, 3 is not possible
M1: Considers the possibility of the orders being 2, 2, 3, 3
A1: Convincing argument that there is only one way of making a graph with vertex orders of 2, 2, 3, 3 (e.g. mention of the fact that the two vertices of order 2 cannot be connected to each other)
For full marks in (c) – there must be some mention of the fact that there cannot be a vertex with order greater than 3 (withhold last A mark if this point is not considered)
(a) Explain what is meant, in a network, by the term path. (2)
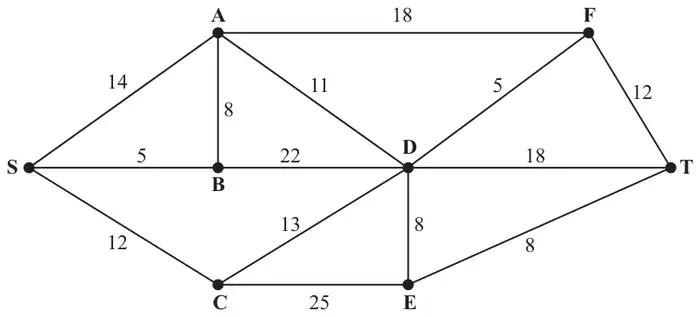
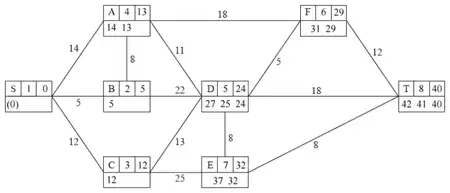
Figure 4 represents a network of canals. The number on each arc represents the length, in miles, of the corresponding canal.
(b) Use Dijkstra’s algorithm to find the shortest path from S to T. State your path and its length. (6)
(c) Write down the length of the shortest path from S to F. (1)
Next week the canal represented by arc AB will be closed for dredging.
(d) Find a shortest path from S to T avoiding AB and state its length. (2)
Mark scheme (a)
Scheme
Marks
A path is a (i) finite sequence of edges, such that (ii) the end vertex of one edge in the sequence is the start vertex of the next, and in which (iii) no vertex appears more than once.
B2, 1, 0
(2)
Notes
a1B1 One of the three points made clearly or two suggested. Arcs (edges)/ vertices (nodes) must be referred to correctly. Do not condone incorrect technical language e.g. point for vertex.
a2B1 All three points made clearly.
Mark scheme (b)
Scheme
Marks
M1 A1 (S,A, B, C) A1ft (D, F) A1 (E, T)
Shortest path: SBADET Length: 40 (miles)
B1 B1ft
(6)
Notes
b1M1 A larger value replaced by a smaller value at least once at A or D or E or F or T.
b1A1All values in S, A, B and C correct. The working values at A must be in the correct order. Condone lack of 0 in S’s working value.
b2A1ft All values in D and F ft correctly and working values in the correct order. F must be labelled before E but penalise order of labelling only once per question.
b3A1 All values in E and T correct and working values in the correct order. Penalise order of labelling only once per question.
b1B1 Route CAO
b2B1ft Their final value ft (if answer is not 40 ft their final value at T)
Mark scheme (c)
Scheme
Marks
Shortest distance S to F = 29 (miles)
B1ft
(1)
Notes
c1B1ft Their final value ft (if answer is not 29 ft their final value at F)
Mark scheme (d)
Scheme
Marks
SADET or SCDET; of length 41 (miles)
B1 B1
(2)
(11 marks)
Notes
d1B1 Either route CAO
d2B1 Length CAO (condone lack of (or incorrect) units throughout)
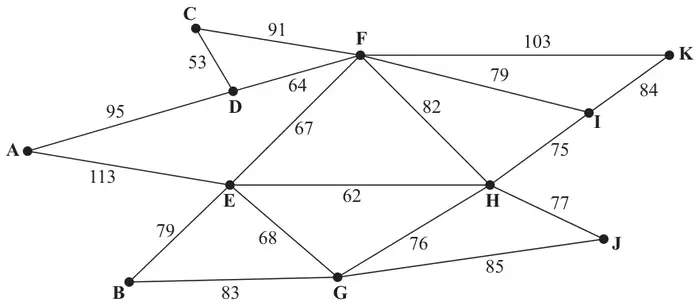
Figure 3 models a system of underground pipes. The number on each arc represents the length, in metres, of that pipe.
Pressure readings indicate that there is a leak in the system and an electronic device is to be used to inspect the system to locate the leak. The device will start and finish at A and travel along each pipe at least once. The length of this inspection route needs to be minimised.
(b) Use the route inspection algorithm to find the pipes that will need to be traversed twice. You should make your method and working clear. (5)
(c) Find the length of the inspection route. (1)
Pipe HI is now found to be blocked; it is sealed and will not be replaced. An inspection route is now required that excludes pipe HI. The length of the inspection route must be minimised.
(d) Find the length of the minimum inspection route excluding HI. Justify your answer. (2)
(e) Given that the device may now start at any vertex and finish at any vertex, find a minimum inspection route, excluding HI. (2)
Mark scheme (a)
Scheme
Marks
The valency of a vertex is the number of edges incident to it.
B2,1,0
(2)
Notes
a1B1 Give bod but refers to arc/edge and to node/vertex
a2B1 A clear, correct statement. CAO.
Mark scheme (b)
Scheme
Marks
DE + HI = 131 + 75 = 206
M1 1A1
DH + EI = 146 + 137 = 283
2A1
DI + EH = 143 + 62 = 205*
3A1
Arcs EH, DF and FI will be traversed twice.
4A1ft
(5)
Notes
b1M1 Three pairings of their four odd nodes
b1A1 One row correct including pairing and total
b2A1 Two rows correct including pairing and total
b3A1 Three rows correct including pairing and total
b4A1ft Their smallest repeated arcs, (accept DFI).
Mark scheme (c)
Scheme
Marks
Route length = 1436 + 205 = 1641(m)
B1ft
(1)
Notes
c1B1ft Must have a choice of at least two pairs seen in part (b). 1436 + their least from (a).
Mark scheme (d)
Scheme
Marks
Since HI is removed only D and E are odd, So only the route between DE need to be repeated Route length = 1436 – 75 (for HI) + 131 = 1492(m)
M1 A1
(2)
Notes
d1M1 Aim to include their DE(131) [ft from (b)] and remove HI(75) or 1436+131–75
d1A1 CAO 1492. Must see method though, NMS gets M0.
Mark scheme (e)
Scheme
Marks
Route should start and finish at D and E. E.g. DCFDAEBGEFKIFHJGHE (18 vertices)
M1, A1
(2)
(12 marks)
Notes
e1M1 D and E identified as start and finish nodes. We do not have to see a route here.
e1A1 CAO must see a route. 18 vertices; Each of A–K present; 3E’s, 3F’s, 2D’s, 2G’s and 2H’s.
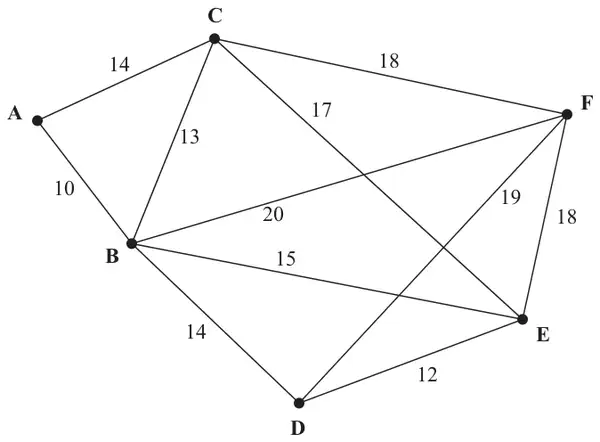
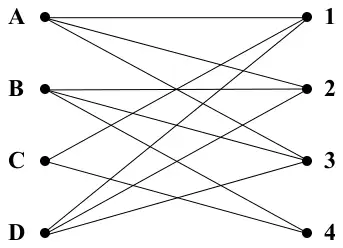
(b) Use Kruskal’s algorithm to find a minimum spanning tree for the network shown in Figure 1. You should list the arcs in the order in which you consider them. In each case, state whether you are adding the arc to your minimum spanning tree. (3)
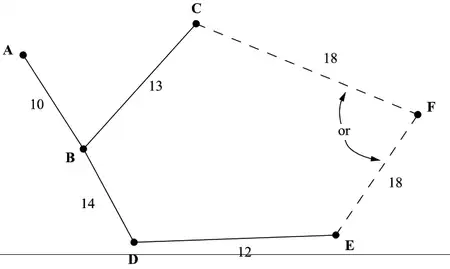
(c) Draw your minimum spanning tree using the vertices given in Diagram 1 in the answer book. (1)
(d) State whether your minimum spanning tree is unique. Justify your answer. (1)
Mark scheme (a)
Scheme
Marks
(i) A tree is a connected graph with no cycles/circuit
B1
(ii) A minimum spanning tree is a tree that contains all vertices and
B1
the total length of its arcs (weight of tree) is as small as possible.
B1
(3)
Notes
(a)1B1 Connected + no cycles
2B1 Contains all vertices
3B1 Total length of arcs used minimised or minimum weight. (Not shortest/smallest etc.)
Mark scheme (b)
Scheme
Marks
AB, DE, BC; \(\left\{\begin{matrix}\text{reject AC}\\ \text{BD}\end{matrix}\right\}\) reject BE, reject CE, use either EF or CF
M1; A1 A1
(3)
Notes
(b)M1 First four arcs selected correctly in correct order.
1A1 Arcs selected correctly at correct time
2A1 Rejections correct and at correct time
Mark scheme (c)
Scheme
Marks
B1
(1)
Notes
(c)B1 CAO
Mark scheme (d)
Scheme
Marks
No, there are two solutions since either EF or CF should be used.
B1
(1)
(8 marks)
Notes
(d)B1 CAO - mark explanation must specify two arcs of 18 or two 18’s or ref to EF and CF
2. Prim’s algorithm finds a minimum spanning tree for a connected graph.
(a) Explain the terms
(i) connected graph,
(ii) tree,
(iii) spanning tree.
(3)
(b) Name an alternative algorithm for finding a minimum spanning tree. (1)
Cambridge
London
Norwich
Oxford
Portsmouth
Salisbury
York
Cambridge (C)
-
60
62
81
132
139
156
London (L)
60
-
116
56
74
88
211
Norwich (N)
62
116
-
144
204
201
181
Oxford (O)
81
56
144
-
84
63
184
Portsmouth (P)
132
74
204
84
-
43
269
Salisbury (S)
139
88
201
63
43
-
248
York (Y)
156
211
181
184
269
248
-
Figure 2
Figure 2 shows the distances by road, in miles, between seven cities.
(c)
(i) Use Prim’s algorithm, starting at London, to find the minimum spanning tree for these cities. You must clearly state the order in which you selected the edges of your tree, and the weight of the final tree.
(ii) Draw your tree using the vertices given in Diagram 2 in the answer book.
(5)
Mark scheme (a)
Scheme
Marks
(i) All pairs of vertices connected by a path, but not describing complete graph.
B1
(ii) No cycles
B1
(iii) All nodes connected (accept definition of minimum spanning tree)
B1
(3)
Mark scheme (b)
Scheme
Marks
Kruskal’s (algorithm)
B1
(1)
Mark scheme (c)
Scheme
Marks
(i) L-O 56 L-C 60
M1
C-N 62 O-S 63
A1
S-P 43 C-Y 156
A1
Total length 440 (miles)
A1 =B1
(ii) Tree correct
B1
(5)
(9 marks)
Notes
M1 Using Prim. first 2 correct; A1 Next 2; A1 Finish; A1 Total
Accept weights as indicating arcs.
Misreads – award M1 A0 A0 for these:
Vertices, not edges given L O C N S P Y
Numbers across top, edges either incorrect or not given: 3 1 4 2 6 5 7.
Also accept these, misreading And not starting at L – again M1A0A0
A walk is a finite sequence of arcs such that the end vertex of one arc is the start vertex of the next.
B2, 1, 0
(2)
Notes
1B1: Probably one of the two below but accept correct relevant statement – bod gets B1, generous.
2B1: A good clear complete answer: End vertex = start vertex + finite.
Mark scheme (b)
Scheme
Marks
A tour is a walk that visits every vertex, returning to its starting vertex.
B2, 1, 0
(2)
(4 marks)
Notes
1B1: Probably one of the two below but accept correct relevant statement – bod gets B1, generous.
2B1: A good clear complete answer: Every vertex + return to start.
From the D1 and D2 glossaries
D1
A path is a finite sequence of edges, such that the end vertex of one edge in the sequence is the start vertex of the next, and in which no vertex appears more than once.
A cycle (circuit) is a closed path, ie the end vertex of the last edge is the start vertex of the first edge.
D2
A walk in a network is a finite sequence of edges such that the end vertex of one edge is the start vertex of the next.
A walk which visits every vertex, returning to its starting vertex, is called a tour.
(a) Explain why a network cannot have an odd number of vertices of odd degree. (2)
Figure 4
Figure 4 shows a network of paths in a public park. The number on each arc represents the length of that path in metres. Hamish needs to walk along each path at least once to check the paths for frost damage starting and finishing at \(A\). He wishes to minimise the total distance he walks.
(b) Use the route inspection algorithm to find which paths, if any, need to be traversed twice. (4)
(c) Find the length of Hamish’s route. [The total weight of the network in Figure 4 is 4180 m.] (1)
Mark scheme (a)
Scheme
Marks
e.g. Each edge contributes 2 to the sum of degrees, hence this sum must be even. Therefore there must be an even (or zero) number of vertices of odd degree Hence there cannot be an odd number of vertices of odd degree
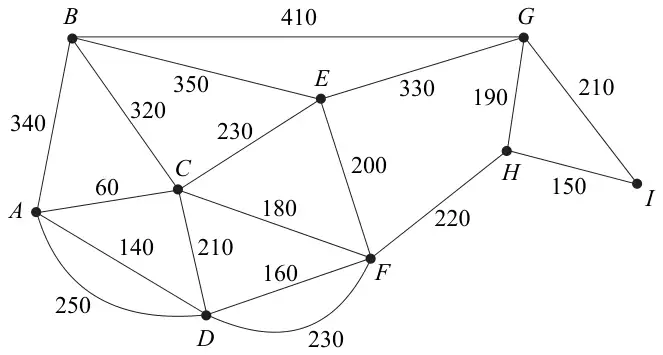
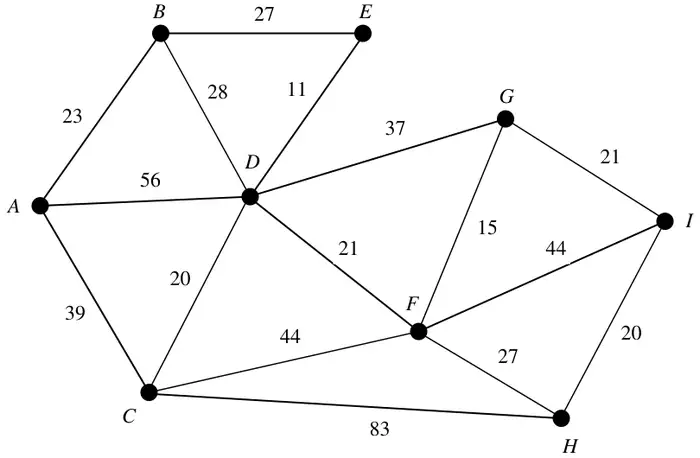
Figure 3 shows a network of cycle tracks. The number on each edge represents the length, in miles, of that track. Mary wishes to cycle from \(A\) to \(I\) as part of a cycling holiday. She wishes to minimise the distance she travels.
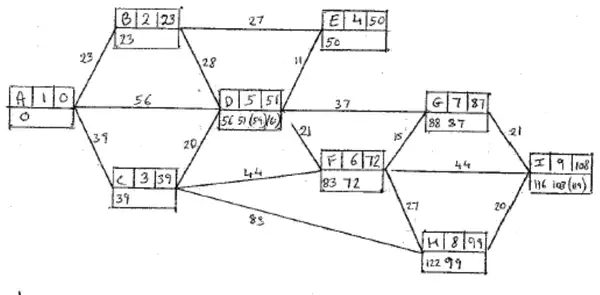
(b) Use Dijkstra’s algorithm to find the shortest path from \(A\) to \(I\). Show all necessary working in the boxes in Diagram 1 in the answer book. State your shortest path and its length. (6)
(c) Explain how you determined the shortest path from your labelling. (2)
Mary wants to visit a theme park at \(E\).
(d) Find a path of minimal length that goes from \(A\) to \(I\) via \(E\) and state its length. (2)
Mark scheme (a)
Scheme
Marks
A path is a (finite) sequence of edges, such that the end vertex of one edge is the start vertex of the next and in which no vertex appears more than once / no cycles
B2,1,0
(2)
Notes
B2 A good, complete description
B1 close – mostly there. ‘bod’ gets B1. ‘route’, ‘series’ may be ok.
Mark scheme (b)
Scheme
Marks
M1 A1 A1 A1ft
shortest path: \(ABDFGI\), length: 108 miles
A1, A1ft
(6)
Notes
M1 In \(D, F, G, H\) or \(I\) working value, larger replaced by smaller
A1 \(A, B, C, E\) correct labels in a rising sequence
A1 \(D, F\) correct labels ft
A1ft \(G, H, I\) correct labels ft (penalise order of labelling once only)
A1 Path c.a.o.
A1ft Length ft from \(I\); accept 108 if a correct path
Mark scheme (c)
Scheme
Marks
e.g. \(108 - 21 = 87\ \ GI\) \(87 - 15 = 72\ \ FG\) \(72 - 21 = 51\ \ DF\) \(51 - 28 = 23\ \ BD\) \(23 - 23 = 0\ \ AB\) or – trace back from \(I\) – include arc \(XY\) if \(Y\) is already on the path and if the difference in final labels equals the length of arc
B2ft,1ft,0
(2)
Notes
B2ft complete version of one of the 2 given explanations
B1ft All there bar one step. ‘bod’ gets B1 – easy mark