
IMC 2013 Q16
16. Which diagram shows the graph of \(y = x\) after it has been rotated 90° clockwise about the point (1, 1)?
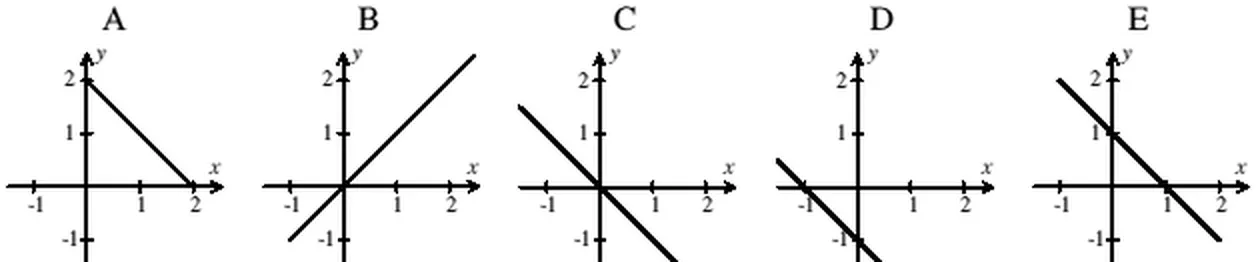
Intermediate Mathematical Challenge 2013, Question 16. © UK Mathematics Trust. Original paper on ukmt.org.uk
Answer: A
The image of a straight line under a rotation is also a straight line. The centre of rotation, the point (1, 1), lies on the given line and so also lies on the image. The given line has slope 1 and so its image will have slope −1. Hence graph A shows the image.
Solution © UK Mathematics Trust, from the IMC 2013 solutions. Longer versions with investigations: Solutions and investigations (PDF).