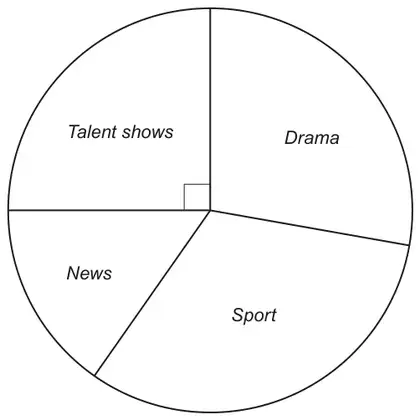
(a) 36 000 people took part in a survey to find out their favourite type of TV programme. The pie chart shows the results.
(i) How many people chose Drama as their favourite type of TV programme? You must show your working. [3]
(ii) Twice as many women as men chose Talent shows as their favourite type of TV programme. Calculate how many women chose Talent shows. You must show your working. [3]
(b) 1000 people were asked,
‘Should news programmes include details of the weather? Yes or No?’
70% of the people answered ‘yes’. A pie chart is to be drawn to represent the answers to this question. What size would the angle be to represent the answer ‘yes’? [2]
Angle representing ‘yes’ is ……………………… °
Mark scheme (a)
Scheme
Marks
Comments
(i) Angle 100° (±2°)
B1
Sight of 100 ignoring any incorrect units is B1 only, until used in a relevant calculation
36000 × 100 (±2) ÷ 360 or 100 × 100 (±2)
M1
FT for M1 only if the angle is out of tolerance but within ±4°
9800 to 10200 (people)
A1
(ii) (Talent show is) ¼ of 36000 and considering 2/3 of this angle or number of people
B1
OR considering 36000 – 'their drama' – 'their sport' – 'their news' if clearly identifiable
⅔ × 36000 × 90 ÷ 360 or ⅔ × 9000 or equivalent
M1
Or 60 × ‘their number of people per degree’ FT 'their ¼ × 36000'
We'd like to use Google Analytics cookies to count visits and see which pages help most. They're optional, and the site works exactly the same either way. Privacy policy