
Higher June 2017 Unit 2 Q20
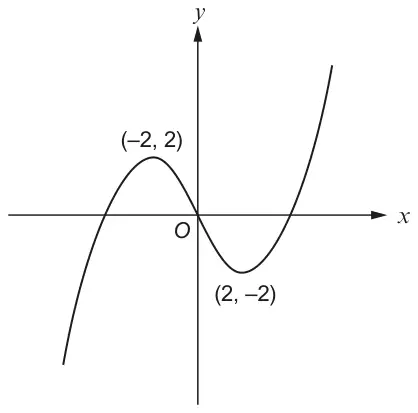
20. A sketch of the graph \(y = f(x)\) is shown below.
Two specific points are shown on the graph. They are called a maximum point and a minimum point.
The maximum point shown is (–2, 2) and the minimum point shown is (2, –2).
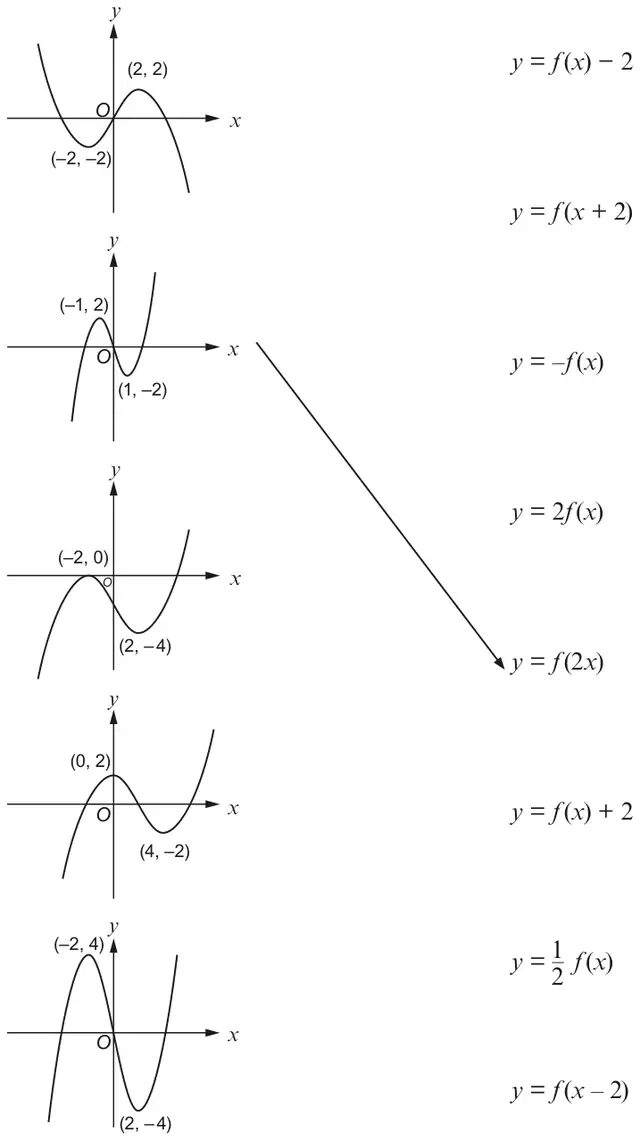
The graphs below are transformations of \(y = f(x)\).
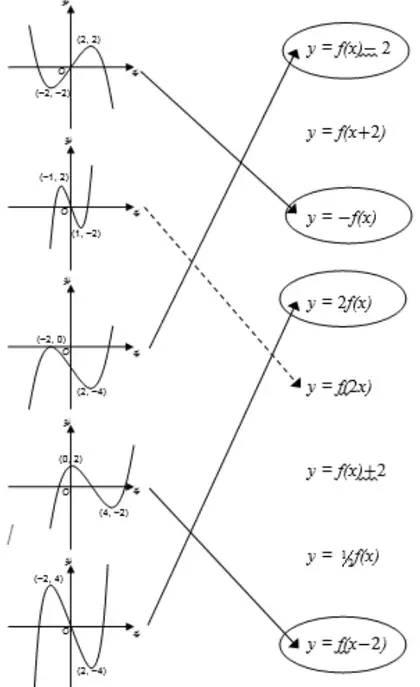
Draw a line connecting each graph to the equation describing the transformation.
One has been done for you. [4]
| Scheme | Marks | Comments |
|---|---|---|
 | B1 B1 B1 B1 |