3. Lloyd has carried out a survey in his school. He surveyed 300 pupils. Below is a section from his questionnaire.
1. Which year group are you in? ……………
2. Do you like the colours of the school uniform? ……………
3. What is your favourite colour? ……………………
(a) Afterwards, Lloyd thinks he should have given option boxes in questions 1 and 2. What could these option boxes be? [2]
Question 1:
Question 2:
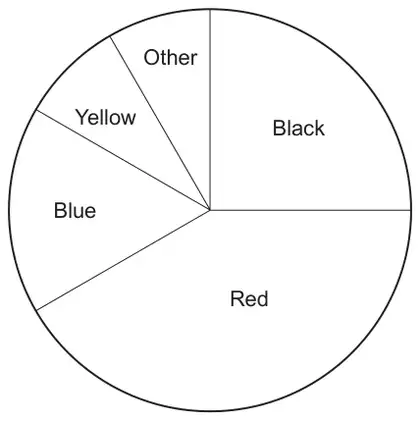
(b) A pie chart displaying the results from question 3 of the questionnaire is shown below.
(i) Which colour was chosen by 75 pupils as their favourite colour? Circle your answer. [1]
Black Red Blue Yellow Other
(ii) What fraction of the pupils said that blue was their favourite colour? Give your answer in its simplest form. [3]
Mark scheme (a)
Scheme
Marks
Comments
Gives a list of at least 3 year groups, e.g. '7, 8, 9, (10, 11, 12, 13)', ‘reception, 1, 2, (3, 4)', OR states, e.g. ‘Year Group boxes’, ‘Year 7 – Year 11’, ‘Year 7, Year 8 and so on’ ‘Year 7 to 9, Years 10 and 11’
B1
In either order Allow if at least 2 groups are given, with no overlaps or repeats, e.g. ‘Key Stage 3, Key Stage 4’
Gives options, e.g. 'yes, no, (don’t care)' , 'yes, no', 'yes, no, other' OR states, e.g. ‘yes and no boxes’
B1
Corrected by Westie's Workshop
The board's mark scheme printed “Allow if a least 2 groups”. Changed to “Allow if at least 2 groups” because “a least” is a misprint for “at least”.
Original: see the board's mark scheme PDF (link above).
Mark scheme (b)
Scheme
Marks
Comments
(i) Black
B1
(ii) Measures the angle 60° ± 2°
B1
Check diagram FT for 60° ± 2° Allow for appropriate sight of 60, e.g. 60/100, 60%, 60 people, but not as a denominator. Example of inappropriate sight of 60: 300/5 = 60 or 300 ÷ 5 = 60, B0
(Fraction) 60/360
M1
FT 60° ± 2° but ≠ 60° for M1 only Allow sight of 300 × 60/360 or 6/36
1/6
A1
CAO Allow B1, M1, A0 for an answer of 50 (people) Award B1, M1, A1 for an answer of 1/6 from sight of 360/60
Alternative: 50/300 M2 1/6 A1
If no marks, award SC1 for FT ‘blue’ from (b)(i) for an answer of (75/300 =) ¼ in (b)(ii)
Corrected by Westie's Workshop
The board's mark scheme printed “FT ‘blue’ from (a) for an answer of (75/300 =) ¼ in (b)”. Changed to “from (b)(i) … in (b)(ii)” because the colour is chosen in part (b)(i) and the fraction is worked out in part (b)(ii); part (a) is about option boxes.
Original: see the board's mark scheme PDF (link above).
We'd like to use Google Analytics cookies to count visits and see which pages help most. They're optional, and the site works exactly the same either way. Privacy policy