
Numeracy Foundation June 2018 Unit 2 Q10
10. Carys has to write a report on the water levels of the River Tad.
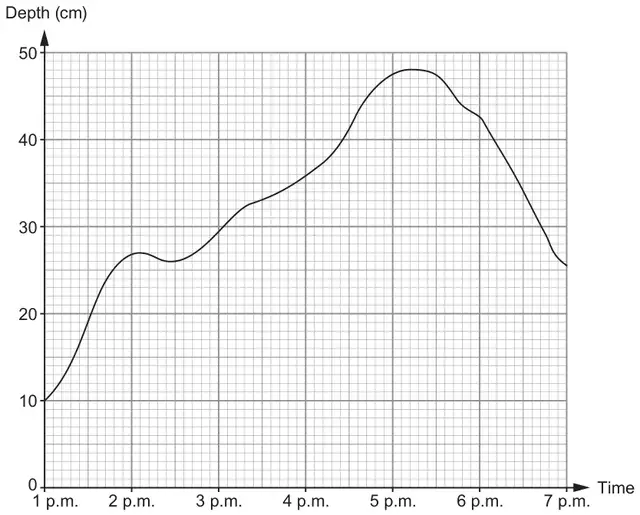
She has recorded the depth of the water in the River Tad between 1 p.m. and 7 p.m.
This is shown in her graph below.
(a)
What was the greatest recorded depth of water in the river?
Circle your answer. [1]
26 cm 27 cm 46 cm 48 cm 50 cm
(b)
In which of these 15-minute periods was the depth of water increasing most rapidly?
Circle your answer. [1]
1:15 p.m. to 1:30 p.m. 4:15 p.m. to 4:30 p.m. 5:00 p.m. to 5:15 p.m.
6:00 p.m. to 6:15 p.m. 6:15 p.m. to 6:30 p.m.
(c) Carys looks at the part of the graph for the period 6 p.m. to 7 p.m.
Describe what this tells her about the river. [1]
Describe what this tells her about the river. [1]
(d)
For what period of time was the depth of water in the river greater than 45 cm?
Circle your answer. [1]
48 minutes 1 hour 1 hour 12 minutes
1 hour 24 minutes 1 hour 30 minutes
| Scheme | Marks | Comments |
|---|---|---|
| 48 cm | B1 |
| Scheme | Marks | Comments |
|---|---|---|
| 1:15 p.m. and 1:30 p.m. | B1 |
| Scheme | Marks | Comments |
|---|---|---|
| Suitable explanation, e.g. 'water level drops', 'depth of the water falls', ‘depth is decreasing (during low tide)’, ‘depth of water is decreasing’, ‘water level decreased at night’, ‘tide goes down’ | E1 | Ignore any additional comments or values Must refer to 'water' or ‘depth’ Allow, e.g. ‘when the water starts to run shallower’ Do not accept, e.g. 'negative gradient', 'goes down', ‘decrease going into the evening’, ‘depth of river is lower at this time’, ‘when the water starts to run shallow’, ‘river is dropping’, 'it drops', ‘it is decreasing’, ‘it goes down’ |
| Scheme | Marks | Comments |
|---|---|---|
| 1 hour | B1 |