(a) The mass of rubbish recycled is given as a percentage of the total mass of rubbish produced.
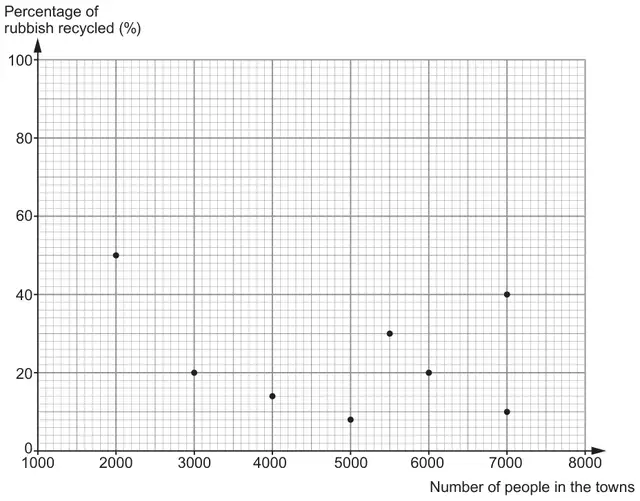
The percentage of rubbish recycled by people living in 8 small towns was recorded. The results for the first week in July 2005 are shown in the scatter diagram below.
(i) Complete each of the statements below. [2]
‘In July 2005, two of the 8 towns had the same number of people. The percentages of rubbish recycled in these two towns were
…………… % and …………… %.’
‘The town with the least number of people had set a target of recycling 45% of rubbish for July 2005. This small town beat this target by …………… %’
(ii) Explain why it is not reasonable to use this data to estimate the percentage of rubbish recycled in a town of 9000 people. [1]
(b) In 2016, Merefod town council recorded the total mass of rubbish recycled. Of this total mass, 130 230 tonnes was paper and cardboard.
This amount of paper and cardboard was \(\dfrac{1}{4}\) of the total mass of rubbish recycled.
Calculate the total mass of rubbish recycled. [2]
Mark scheme (a)
Scheme
Marks
Comments
(i) 10(%) and 40(%) in either order
B1
5(%)
B1
(ii) A suitable explanation based on any one of:
no correlation
no data for towns above 7000
small sample
e.g. ‘no correlation’, ‘no pattern (to the results)’, ‘no relationship (between the number of people and the percentage of rubbish)’
E1
Accept, e.g. ‘outside the range of data collected’, 'only data between 2000 to 7000 people', ‘results vary too much’, ‘the data stops at 7000’
Allow, e.g. ‘not enough data’, ‘no data for a town this big’, ‘was only done for first week in July’, ‘there are only 8 towns’
Do not accept, e.g. 'no town with 9000 people', 'no data at 9000 people', 'it is off the graph', ‘graph doesn’t reach 9000 people’, ‘not suitable’, ‘may not be accurate’, ‘unpredictable’, ‘no data for 8000’, ‘each town is different’, ‘no data for a town of this size’, ‘9000 is not a small town’
We'd like to use Google Analytics cookies to count visits and see which pages help most. They're optional, and the site works exactly the same either way. Privacy policy