
Numeracy Intermediate November 2017 Unit 1 Q9
9. William owns and runs dog kennels.
His costs depend on the number of dogs in the kennels.
The running costs for one day are shown on the graph below.
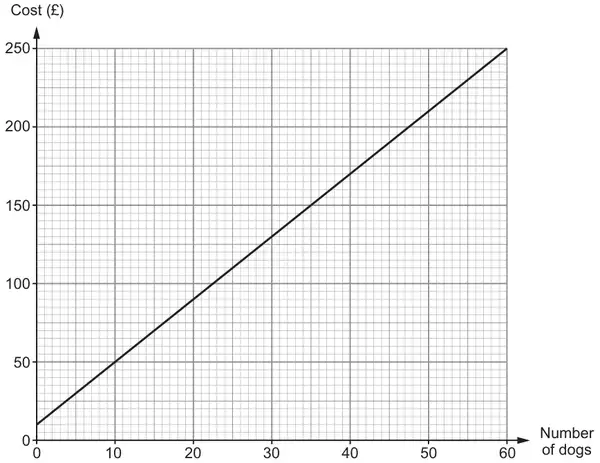
(a) Why does the graph not pass through (0, 0)? [1]
(b) What is the increase in the daily running costs for each additional dog that is kept in the kennels? [2]
(c)
(i) Freda also runs a dog kennels.
The cost of keeping 20 dogs in her kennels for one day is £130.
She knows that as the number of dogs increases, the overall cost increases at the same rate as in William’s kennels.
The cost of keeping 20 dogs in her kennels for one day is £130.
She knows that as the number of dogs increases, the overall cost increases at the same rate as in William’s kennels.
Display this information on the graph paper above. [2]
(ii) Find the cost of keeping 30 dogs for one day in Freda’s kennels. [1]
£ ……………
| Scheme | Marks | Comments |
|---|---|---|
| Reason, e.g. ‘fixed costs', 'still has some costs to pay', ‘because it costs to run the place’, ‘because it costs to run without dogs’, ‘still has to pay electricity’, ‘there is a starting cost’, ‘(s)he still has to pay bills’ | E1 | Do not accept, e.g. ‘the costs start at £10’ |
| Scheme | Marks | Comments |
|---|---|---|
Suitable calculation to find the gradient, e.g.
| M1 | |
| (£) 4 | A1 | CAO, accept unsupported (£)4 (for M1, A1) If units are given they must be correct |
| Scheme | Marks | Comments |
|---|---|---|
| (i) Line drawn parallel to the line given through 20(dogs) (£)130 | B2 | Mark intention of a parallel line B1 for 1 of the following:
|
| (ii) A reading from the graph provided it is between £168 to £172 inclusive, or (a calculation leading to) £170 | B1 | FT 'their straight line graph' (positive gradient) with the same tolerance ±£2 |