
Numeracy Higher June 2018 Unit 1 Q13
13. The heights of all the Year 11 girls at a school were measured.
Nia has started to draw a histogram of the results.
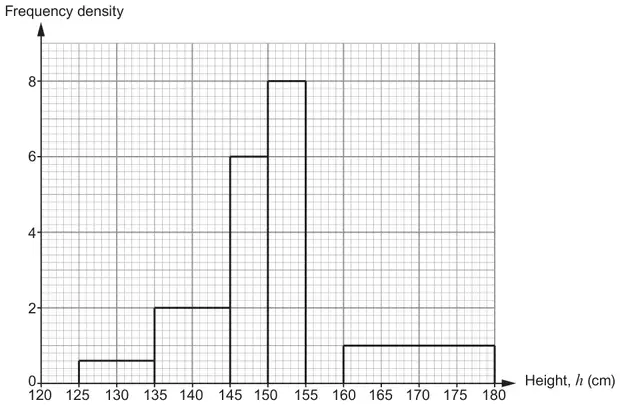
(a) There were 24 girls in Year 11 whose heights were in the group \(155 \lt h \leqslant 160\) cm.
Use this information to complete Nia’s histogram. [2]
Use this information to complete Nia’s histogram. [2]
(b) Nia has started to do some data analysis on the heights of the Year 11 girls.
She has estimated the median and the upper quartile, as shown in the table below.
She has estimated the median and the upper quartile, as shown in the table below.
| Lower quartile | Median | Upper quartile |
|---|---|---|
| …………………… | 151·75 cm | 156·875 cm |
Use the histogram to calculate an estimate of the lower quartile of the heights of the Year 11 girls. [6]
| Scheme | Marks | Comments |
|---|---|---|
| Appropriate bar of height 4·8 | B2 | B1 for sight of 24 ÷ 5 or 4·8 |
| Scheme | Marks | Comments |
|---|---|---|
| 10×0·6 + 10×2 + 5×6 + 5×8 (+ 24) + 20×1 | M1 | Allow M1 for at least 4 correct products |
| = 140 | A1 | CAO Alternative method: M1 for 10×0·6 + 10×2 + 5×6 + 1·75×8 Allow M1 for 3 correct products which must include 1·75×8 A1 for 70 CAO |
| Search for height in the group 145 to 150 | S1 | FT ‘their 140’ ÷ 4, and M1 previously awarded |
| 6x = 9 OR 6x = 21 | M1 | OR \(\dfrac{9}{30}\) × 5 OR \(\dfrac{21}{30}\) × 5 |
| x = 1·5 OR x = 3·5 | A1 | |
| (Lower quartile =) 146·5 (cm) | A1 | Or equivalent |