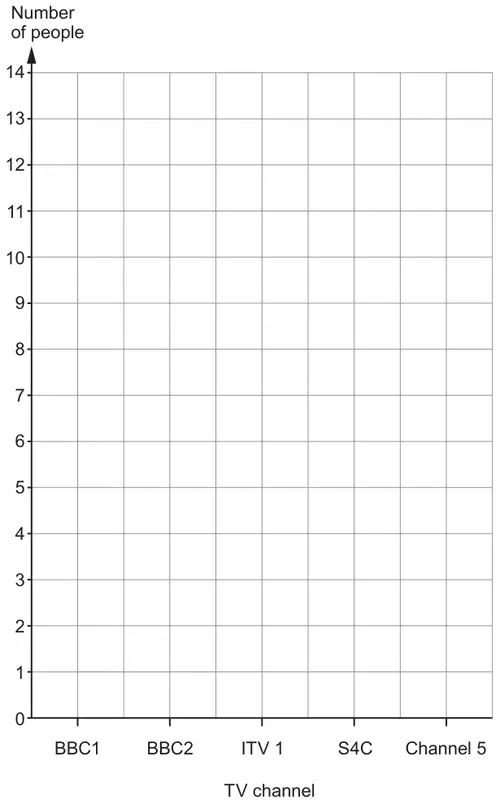
2. Jane carried out a survey. She asked 40 people to choose their favourite TV channel. Their answers are shown below.
BBC1
S4C
ITV 1
BBC1
Channel 5
ITV 1
BBC2
Channel 5
ITV 1
BBC1
Channel 5
BBC1
Channel 5
ITV 1
S4C
S4C
ITV 1
BBC2
BBC1
Channel 5
BBC2
BBC2
ITV 1
ITV 1
BBC1
BBC2
ITV 1
S4C
BBC1
ITV 1
BBC1
S4C
ITV 1
ITV 1
BBC1
ITV 1
Channel 5
BBC1
S4C
Channel 5
(a) Draw a vertical line diagram to display Jane’s data. Use the square grid below. [4]
(b) How can you check that you have included all of Jane’s data? [1]
(c) What is the modal TV channel? [1]
Mark scheme (a)
Scheme
Marks
Comments
BBC1=10 BBC2=5 ITV1=12 S4C=6 Channel 5=7
B2
May be seen or implied from their vertical line diagram (or other diagram/graph) or in part (b))
Award B1 for any three or four correct frequencies seen or implied.
Five vertical lines at correct heights. (intention of correct height eg line drawn for 10 but not quite at 10)
B2
FT their frequencies throughout if seen. If frequencies not seen FT their tallies.
If B2 not awarded Award B1 for any 3 or 4 correct vertical lines. (May imply previous B1 or B2) OR Award B1 for any 3 or 4 heights correct in a bar chart or other diagram, including a scatter diagram.
Note: If vertical line diagram drawn with no frequencies or tallies seen but one or two heights incorrect as evidence of one error in collecting data award B1 B2.
If no marks awarded, award B1 for all 5 correct tallies.
Mark scheme (b)
Scheme
Marks
Comments
Correct explanation given Eg ‘add up the frequencies to see if they come to 40 (which is the total number of people asked).’ ‘add up to see if it gives the total’
E1
Reference to 40 or the total is needed.
Do not accept ‘Look back at the table’ ‘Crossing them out after putting them in graph’ ‘Ticking off the ones you have done’ ‘I have counted all the 5 different TV shows and put them in the right order above’ ‘Go over it again’ ‘Check if you counted them all’ ‘I could look at her results to make sure I’ve counted correctly’ ‘By counting them row by row’
However accept: ‘Check if you counted them all’ ‘I could look at her results to make sure I’ve counted correctly’ ‘By counting them row by row’ if a sum of the frequencies to 40 is seen in part (a) or (b).
We'd like to use Google Analytics cookies to count visits and see which pages help most. They're optional, and the site works exactly the same either way. Privacy policy