
Higher November 2018 Unit 2 Q16
16. The graph of \(y = 18 + 3x - x^2\), for values of \(x\) from \(x\) = 0 to \(x\) = 6, is drawn below.
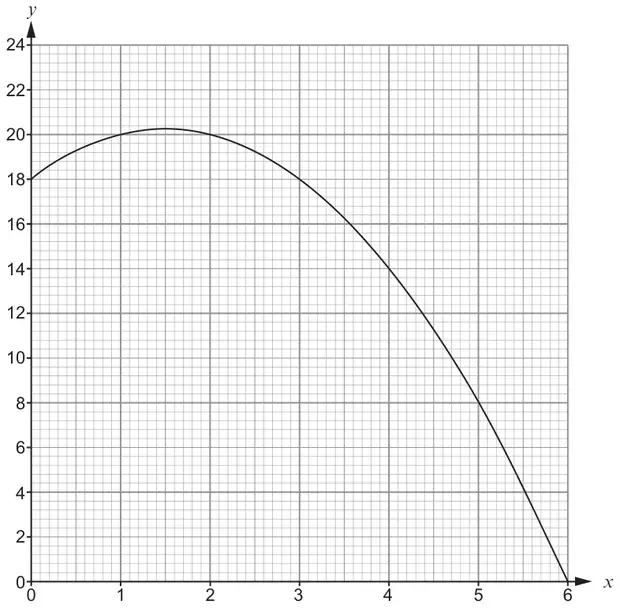
Use the trapezium rule, with the ordinates \(x\) = 0, \(x\) = 1, \(x\) = 2, \(x\) = 3, \(x\) = 4, \(x\) = 5 and \(x\) = 6, to estimate the area of the region bounded by the curve, the positive \(x\)-axis and the positive \(y\)-axis. [3]
From the formula list: Area of trapezium \(= \dfrac{1}{2}(a+b)h\)
| Scheme | Marks | Comments |
|---|---|---|
| (Area=) ½×[18+0+2(20+20+18+14+8)] | M2 | Award M1 for 5 or more values correct and up to 1 incorrect OR all values correct but \(h\) incorrect. |
| = 89 | A1 | FT from M1. Condone 892 if offered as the final answer. |
Alternative method:
| Scheme | Marks | Comments |
|---|---|---|
| \(\tfrac{(18+20)}{2} + \tfrac{(20+20)}{2} + \tfrac{(20+18)}{2} + \tfrac{(18+14)}{2} + \tfrac{(14+8)}{2} + \tfrac{(8+0)}{2}\) (Individual areas are: 19, 20, 19, 16, 11, 4.) = 89 | M2 A1 | Each area may be seen as the sum of the area of a rectangle and a triangle. M1 for the correct calculation for any 4 trapezia (not necessarily added together) OR if an incorrect \(h\) is used throughout. FT from M1. Condone 892 if offered as the final answer. Treat splitting area into 12 parts as MR-1. |