
Higher November 2017 Unit 1 Q11
11.
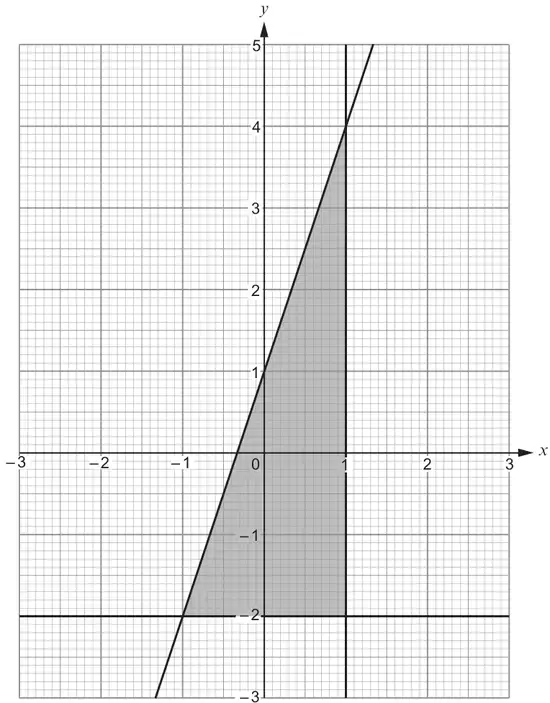
Complete the following table to give the set of inequalities that describes the shaded region shown above. [3]
| \(x \leqslant 1\) |
| Scheme | Marks | Comments |
|---|---|---|
| \(y \geqslant\) -2 or equivalent | B1 | Accept ‘>’ |
| \(y \leqslant 3x + 1\) or equivalent | B2 | Accept ‘<’. B1 for \(y = 3x + 1\) or \(y \gt 3x + 1\) or \(y \geqslant 3x + 1\) B1 for \(y \leqslant kx + 1\) or \(y \lt kx + 1\) (with \(k \ne 3\) and \(k \gt 0\)) B1 for \(y \leqslant 3x + c\) or \(y \lt 3x + c\) (with \(c \ne 1\)) |