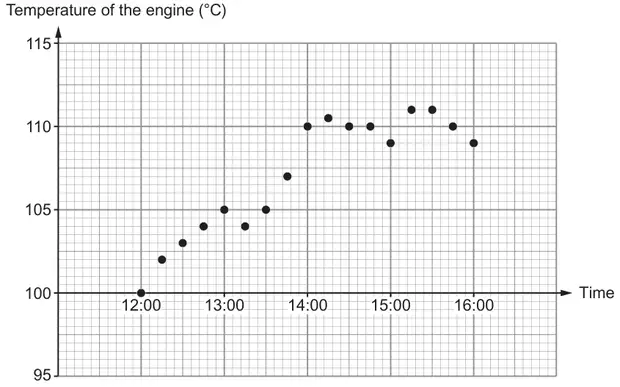
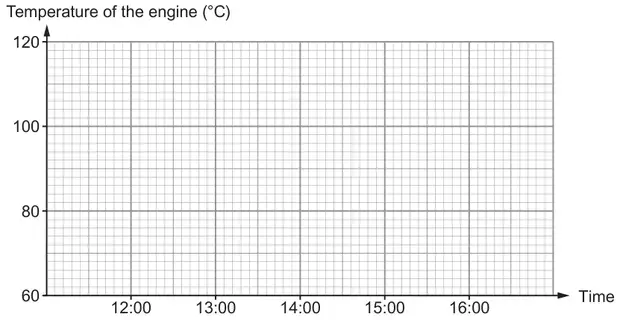
Plotting of 100 and 110 should be intention of being on the appropriate line Tolerance for plotting 105 and 109 is within the appropriate small square Ignore any joining of plotted points
(ii) Appropriate reason, e.g. ‘the rise in temperature doesn’t look very much’, ‘it is only temperatures from 100°C that are needed’, ‘not showing the warning light was on as often as it was’, ‘it doesn’t show the fluctuating temperature’, ‘doesn’t show the number of warnings given (when over 110°C)’, ‘more details are required to show the warnings’,
E1
Ignore additional spurious or incorrect statements for accepted and allowed responses
Allow, e.g. ‘misleading’ with a suitable reason given ‘doesn’t give the same detail (as the first graph)’, ‘doesn’t give the details of temperature changes’, ‘it doesn’t show all the temperature changes’, ‘doesn’t give the same accuracy (as the first graph)’, ‘doesn’t give the accurate temperature changes’, ‘only shows specific times’, ‘only recording once an hour’, ‘there is no data to fill the gaps’, ‘the temperatures between are not shown’, It doesn’t give all the information’, ‘not all the points plotted from the previous graph’, ‘small scale’, ‘the temperature goes up in 2’s rather than 0.5’, ‘lost loads of the data’, ‘there are not many points’, ‘it doesn’t change much to show when something went wrong’, ‘there are no temperatures recorded below 100°C’
Do not accept, e.g. ‘misleading’, ‘not accurate’, ‘it doesn’t give the accurate temperatures’, ‘the temperatures aren’t the same as the first graph’, ‘most points are not over 110°C’, ‘the temperature goes higher on the axis than the other graph’
We'd like to use Google Analytics cookies to count visits and see which pages help most. They're optional, and the site works exactly the same either way. Privacy policy