
Numeracy Intermediate November 2019 Unit 1 Q3
3. The students in Mr Griffin’s mathematics class all recorded how long they spent on their last mathematics homework.
None of his students spent less than 10 minutes on this homework.
All of his students attempted the homework.
Mr Griffin has drawn a frequency diagram to display the times recorded by his students.
He used groups of width 10 minutes:
\(10 \leqslant \text{time} \lt 20,\) \(20 \leqslant \text{time} \lt 30,\) and so on.
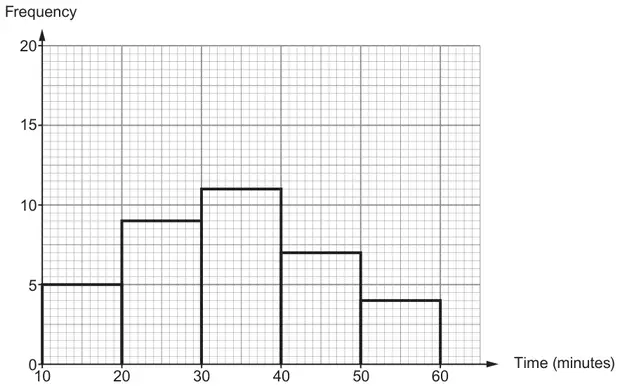
(a) Did any student get all their mathematics homework correct?
Yes ☐ No ☐ Can’t tell ☐
You must give a reason for your answer. [1]
(b) How many students are there in Mr Griffin’s mathematics class? [2]
(c) Consider the students who spent less than 40 minutes on their homework.
What fraction of these students spent 30 minutes or more on their homework? [2]
What fraction of these students spent 30 minutes or more on their homework? [2]
| Scheme | Marks | Comments |
|---|---|---|
| States or implies ‘Can’t tell’ with a reason, e.g. ‘diagram doesn’t show how accurate the homework was’, ‘it only gives the times spent on homework’, ‘doesn’t say what the students’ marks were’, ‘doesn’t show if students got homework correct or not’, | E1 | Allow, e.g. ‘the given information (only) shows they attempt homework’ ‘graph doesn’t give this detail’, ‘diagram doesn’t show data for that’, ‘because it doesn’t specify it’, ‘because there is no data about it’, ‘it says “attempted” doesn’t say if they were right or wrong’, ‘it (only) shows times’, ‘doesn’t show percentages’, ‘no results available’, ‘it doesn’t say if they had it wrong or not’, ‘no marks’ Do not accept, e.g. ‘we don’t know how many marks there are to be earned’, ‘it shows frequency’, ‘doesn’t show how much homework to get a mark’, ‘because there is no correlation with the graph’, ‘because it doesn’t state what the homework was out of’ |
Corrected by Westie's Workshop
- The board's mark scheme printed “doesn’t say what the students marks were”. Changed to “doesn’t say what the students’ marks were” because the apostrophe is missing (the marks belong to the students).
Original: see the board's mark scheme PDF (link above).
| Scheme | Marks | Comments |
|---|---|---|
| 5 + 9 + 11 + 7 + 4 | M1 | Allow M1 if one error in working with 5 numbers (check diagram also, but intention to add must be clear) |
| 36 (students) | A1 | CAO |
| Scheme | Marks | Comments |
|---|---|---|
| \(\dfrac{11}{25}\) | B2 | ISW B1 for .../25 or 11/... provided not from incorrect working (e.g. 4 + 7 + 11 = 22, then 22/30 = 11/15 is B0) B1 for an answer of 44% if 11/25 not previously seen |