11. OrenVit is a company that produces bottles of orange juice. The company uses only bottles with a capacity of one litre.
Each day, the cost of producing bottles of orange juice is as follows:
Fixed charge for use of equipment
£10
Cost of ingredients
80p per bottle
Cost of empty bottles with labels
20p per bottle
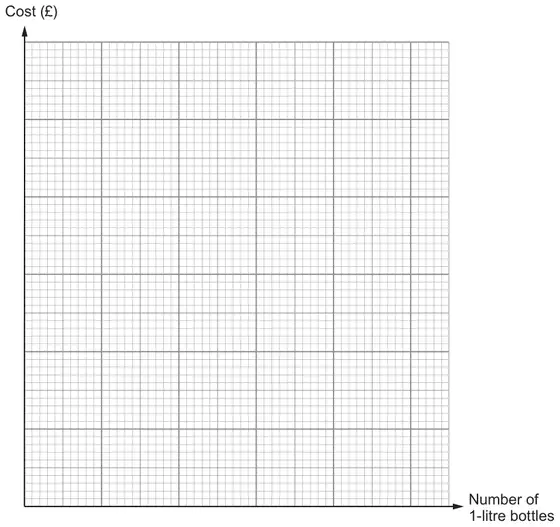
(a) Draw a graph to show the total daily cost of producing between 0 and 100 bottles of orange juice. Use the graph paper below. [3]
(b) One day, OrenVit produces 1750 pints of orange juice in one-litre bottles. Calculate the cost of producing this quantity of orange juice. [3]
Mark scheme (a)
Scheme
Marks
Comments
Suitable uniform scales on both axes, costs to £110 and number of bottles from 0 to 100
B1
Allow for cost axis
starting from £10
final label is £100 (rather than £110 or £120)
suitable for ‘their plotted points’ with increasing costs for increasing number of bottles
Correct representation of costs for 0 to 100 bottles
B2
With no incorrect points plotted Joined with dotted or solid straight line Ignore any additional ‘correct’ points plotted for more than 100 bottles Examples of points:
Bottles
0
20
40
60
80
100
Costs £
10
30
50
70
90
110
B1 for any one of:
One incorrect plot, that is not (0, 10), on an otherwise correct graph. (0,10) must be plotted and joined
correct graph for an inclusive range of 50 bottles
at least 2 correct points plotted, with no incorrect points plotted, ignore vertical lines or ‘line of best fit’. Allow for points not joined
Note: the drawing of a bar chart should only be awarded B1 maximum for the uniform scales
Mark scheme (b)
Scheme
Marks
Comments
1750 ÷ 1.75 or 1750 × 4/7 or 1750 ÷ 7/4
M1
Allow sight of 1000 provided not from incorrect working (not for 1 litre = 1000 ml)
+ 10
m1
£1010
A1
If no marks, award SC1 for sight of ‘÷ 1.75’ or ‘÷ 7/4’ or ‘× 4/7’ or equivalent
We'd like to use Google Analytics cookies to count visits and see which pages help most. They're optional, and the site works exactly the same either way. Privacy policy