
Numeracy Higher November 2023 Unit 1 Q11
11. The graph below shows the depth of water in a reservoir during a 200-day period.
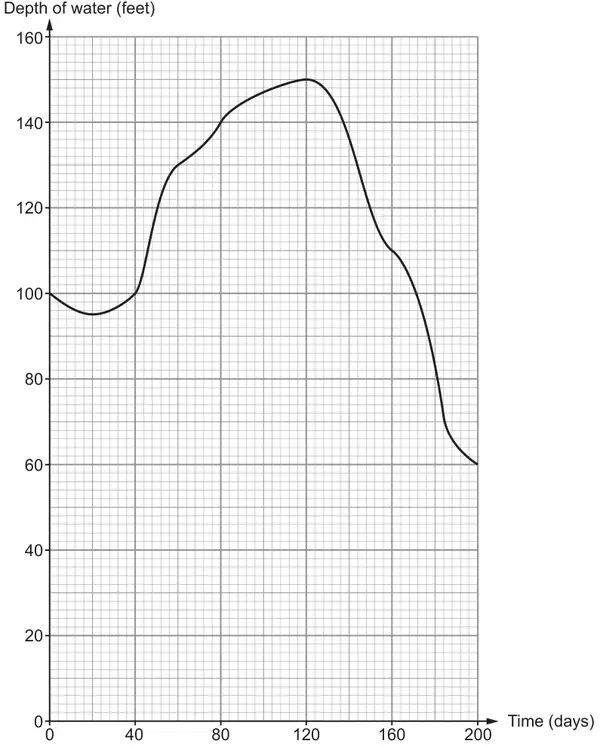
(a) For approximately how many of the 200 days was the depth of water in the reservoir decreasing?
Circle your answer. [1]
Circle your answer. [1]
120 days 200 days 80 days 100 days 40 days
(b) Use 5 strips of width 40 days to estimate the area under the curve.
Hence, calculate an estimate of the average depth of the water during this 200-day period. [5]
Hence, calculate an estimate of the average depth of the water during this 200-day period. [5]
Average depth of water = …………… feet
(c) Estimate the rate of increase in the depth of the water on the 60th day of this period.
Give your answer in its simplest form. [3]
Give your answer in its simplest form. [3]
| Scheme | Marks | Comments |
|---|---|---|
| 100 days | B1 |
| Scheme | Marks | Comments |
|---|---|---|
| \(\dfrac{1}{2}\) × 40 × (100 + 60 + 2(100 + 140 + 150 + 110)) | M2 | M1 for 1 slip in substitution of values OR M1 for 1 of the vertical readings omitted with all others correct |
| = 23 200 | A1 | May be implied in further working FT from M1 is available provided it comes from a calculation with no vertical readings omitted |
| (Average depth of water =) 23 200 ÷ 200 | m1 | FT ‘their 23 200’ provided M1 or M2 previously awarded |
| = 116 (ft) | A1 |
11(b) Alternative method:
| Scheme | Marks | Comments |
|---|---|---|
| \(\dfrac{(100 + 100)}{2}\)×40 + \(\dfrac{(100 + 140)}{2}\)×40 + \(\dfrac{(140 + 150)}{2}\)×40 + \(\dfrac{(150 + 110)}{2}\)×40 + \(\dfrac{(110 + 60)}{2}\)×40 | M2 | M1 for the sum of these 5 areas with one error (may be repeated) in the substitution of values OR M1 for the sight of 5 correct areas with the intention to add them (possibly omitting one) |
| [4000 + 4800 + 5800 + 5200 + 3400] = 23 200 | A1 | May be implied in further working FT from M1 is available provided it comes from the sum of 5 areas |
| (Average depth of water =) 23 200 ÷ 200 | m1 | FT ‘their 23 200’ provided M1 or M2 previously awarded |
| = 116 (ft) | A1 | If no marks awarded, the following SC marks can be awarded for work that involves summing the mean of the 2 heights on either side of each bar, and then dividing by 5 to give an answer of 116 (ft): SC3 for work detailed above with no errors in substitution leading to 580/5 = 116 or SC2 for work detailed above with only 1 error, either in substitution (may be repeated) OR in an answer to a calculation, to arrive at their answer, allowing truncation/rounding of their final answer or SC1 for work detailed above with at most 1 error in substitution AND at most 1 error in an answer to a calculation to arrive at their answer, allowing truncation/rounding of their final answer |
| Scheme | Marks | Comments |
|---|---|---|
| Appropriate tangent drawn at the 60th day | M1 | |
| Difference in y ÷ difference in x | m1 | Allow m1A0 if one difference has been incorrectly calculated |
| Correctly evaluated gradient given in its simplest form and lies within the range 0.3 to 0.8 (ft/day) or equivalent | A1 | Mark final answer Accept a correct proper fraction, decimal or percentage If they give a decimal answer, it needs to be correctly evaluated to at least 1 decimal place, rounded or truncated |