
Numeracy Higher November 2023 Unit 1 Q10
10. Anisa is comparing the ages of the populations of Cardiff and Wrexham in July 2019.
She has used published data to draw these two histograms.
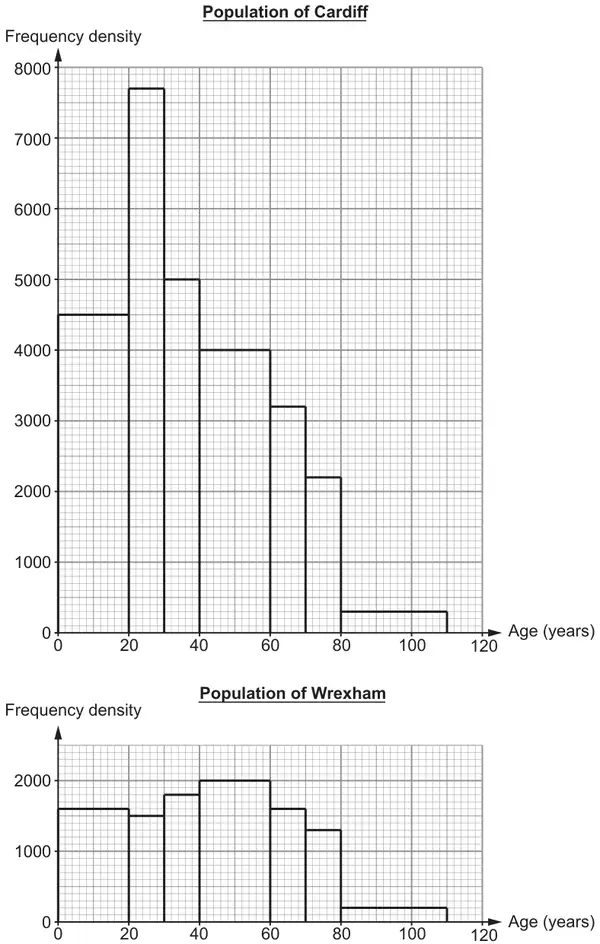
(a) In July 2019, the biggest difference between the populations of Cardiff and Wrexham was in the number of 20- to 30-year-olds.
Calculate how many more 20- to 30-year-olds there were in Cardiff than there were in Wrexham. [2]
Calculate how many more 20- to 30-year-olds there were in Cardiff than there were in Wrexham. [2]
(b) Anisa has used her histograms to carry out data analysis.
Some of her results are shown in the table below.
Some of her results are shown in the table below.
| Cardiff | Wrexham | |
|---|---|---|
| Total population (people) | 360 000 | 140 000 |
| Estimate of the median age (years) | 42·5 |
Use Anisa’s histogram to calculate an estimate of the median age of the population of Cardiff in July 2019. [4]
| Scheme | Marks | Comments |
|---|---|---|
| 62 000 (people) | B2 | B1 for
|
| Scheme | Marks | Comments |
|---|---|---|
| Working from the left of the graph \(\dfrac{360\,000}{2}\) – 4500×20 – 7700×10 OR (from the right) 300×30 + 2200×10 + 3200×10 + 4000×20 + 5000×10 – \(\dfrac{360\,000}{2}\) | M1 | Allow M1 for either calculation with one error only, (not in the 360 000/2) possibly leading to calculations for the median being in the 20-30 or 40-60 groups |
| =13 000 (people needed from the 30-40 bar) | A1 | CAO |
| (Median for Cardiff =) (30 +) \(\dfrac{13\,000}{50\,000}\) ×10 or equivalent | m1 | FT ‘their 13 000’ and the possible different calculation if their work is for the median being in the 20-30 or 40-60 groups i.e. (20 +) \(\dfrac{\text{‘their 13 000’}}{77\,000}\) × 10 for the 20-30 group or (40 +) \(\dfrac{\text{‘their 13 000’}}{80\,000}\) × 20 for the 40-60 group |
| = 32.6 (years) | A1 |
10(b) Alternative method:
| Scheme | Marks | Comments |
|---|---|---|
| Working from the right of the graph \(\dfrac{360\,000}{2}\) – 300×30 – 2200×10 – 3200×10 – 4000×20 OR (from the left) 4500×20 + 7700×10 + 5000×10 – \(\dfrac{360\,000}{2}\) | M1 | Allow M1 for either calculation with one error only, (not in the 360 000/2) possibly leading to calculations for the median being in the 20-30 or 40-60 groups |
| = 37 000 (people needed from the 30-40 bar) | A1 | CAO |
| (Median for Cardiff =) (40 –) \(\dfrac{37\,000}{50\,000}\) ×10 or equivalent | m1 | FT ‘their 37 000’ and the possible different calculation if their work is for the median being in the 20-30 or 40-60 groups i.e. (30 –) \(\dfrac{\text{‘their 37 000’}}{77\,000}\) × 10 for the 20-30 group or (60 –) \(\dfrac{\text{‘their 37 000’}}{80\,000}\) × 20 for the 40-60 group |
| = 32.6 (years) | A1 |