
Numeracy Higher November 2020 Unit 1 Q12
12. Eleri’s cycle computer shows a speed-time graph for the first 60 seconds of her cycle ride.
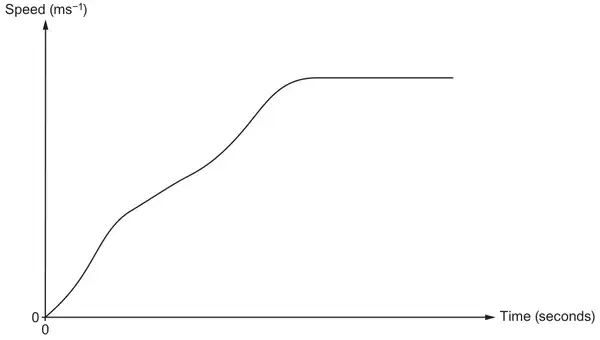
The cycle computer has also generated the following table, showing Eleri’s speed after every 10 seconds, for the first 40 seconds of her ride.
| Time (seconds) | 0 | 10 | 20 | 30 | 40 |
| Speed (ms−1) | 0 | 3 | 4·6 | 6·4 | 8 |
(a) Calculate an estimate of the distance travelled in the first 40 seconds of Eleri’s cycle ride.
You must use 4 strips of equal width. [3]
You must use 4 strips of equal width. [3]
(b) After 40 seconds, Eleri’s speed remained constant.
Calculate an estimate of Eleri’s average speed over the first 60 seconds of her ride.
Give your answer in ms−1, correct to 2 significant figures.
You must show all your working. [5]
| Scheme | Marks | Comments |
|---|---|---|
| (Area =) \(\dfrac{1}{2}\)×10×(0+8 + 2(3 + 4.6 + 6.4)) OR \(\dfrac{1}{2}\)×10×(8 + 6 + 9.2 + 12.8) | M2 | Award M1 if only one value incorrect |
| = 180 (m) | A1 | FT from M1 |
Alternative method:
| Scheme | Marks | Comments |
|---|---|---|
| \(\dfrac{(0 + 3)}{2}\) × 10 + \(\dfrac{(3 + 4.6)}{2}\) × 10 + \(\dfrac{(4.6 + 6.4)}{2}\) × 10 + \(\dfrac{(6.4 + 8)}{2}\) × 10 [15 + 38 + 55 + 72] | M2 | M1 for the sum of these 4 areas with only 1 value (possibly repeated) incorrect |
| = 180 (m) | A1 | FT from M1 |
| Scheme | Marks | Comments |
|---|---|---|
| (Total distance =) 180 + 20×8 | M1 | FT ‘their 180’ from (a) |
| = 340 (m) | A1 | |
| (Average speed =) 340 ÷ 60 | m1 | FT ‘their 340’ |
| = 5.7 (ms-1) | A2 | A1 for 5.6(66…) or 54/6 or for an improper fraction equivalent to 340/60 e.g. 34/6, OR A1 for 6 from correct working OR A1 if their correctly evaluated answer on FT does not require rounding to 2sf |