
Intermediate November 2022 Unit 2 Q4
4. Laura puts 90 counters in a bag.
Each counter is red or blue or yellow.
Laura wants to draw a pie chart to show the number of counters of each colour.
The table below shows some of the information that she needs.
| Number of counters | Pie chart angle | |
|---|---|---|
| Red | 25 | …………… |
| Blue | …………… | 180° |
| Yellow | …………… | …………… |
| Total = 90 |
(a) Complete the table.
You must show all your working. [5]
You must show all your working. [5]
(b) Complete the pie chart to show the results. [2]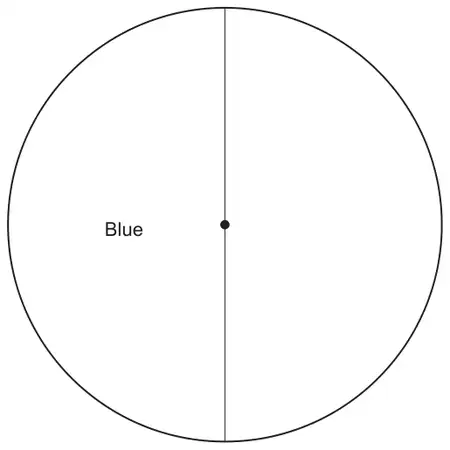
(c) Laura chooses a counter at random from the bag.
Calculate the probability that this counter is either red or blue. [2]
Calculate the probability that this counter is either red or blue. [2]
| Scheme | Marks | Comments |
|---|---|---|
| Blue = 45 | B1 | Answer boxes take precedence. Number of counters must be whole numbers. |
| Yellow = 20 | B1 | FT 90 – 25 – ‘their stated 45’. |
| (Angle for Red = ) \(\dfrac{25}{90}\) × 360 or equivalent OR (Angle for Yellow =) \(\dfrac{20}{90}\) × 360 or equivalent | M1 | FT \(\dfrac{\text{‘their 20’}}{90}\) × 360 or equivalent. |
| (Angle for Red = ) 100(°) | A1 | |
| (Angle for Yellow = ) 80(°) | B1 | FT 360 – 180 – ‘their stated 100’. |
| Scheme | Marks | Comments |
|---|---|---|
| Pie chart drawn correctly and both sectors labelled correctly Angle for Red = 100° Angle for Yellow = 80° | B2 | For B2, FT their angles from (a), provided they add up to 180°. Allow tolerance of ±2° for all angles. Award B1 for one of the following:
|
| Scheme | Marks | Comments |
|---|---|---|
| \(\dfrac{70}{90}\) OR \(\dfrac{7}{9}\) OR \(\dfrac{280}{360}\) or equivalent. ISW | B2 | FT ‘their 45’ + 25 or ‘their 100°’+ 180°, where possible. Award B1 for one of the following:
|