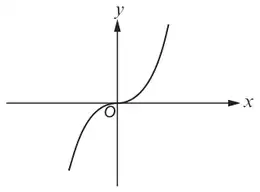
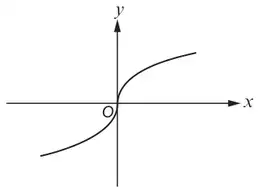
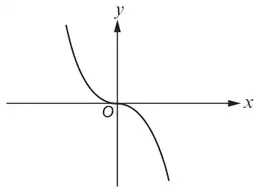
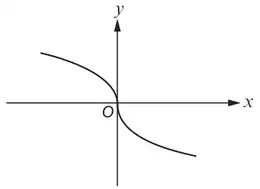
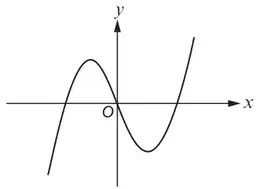
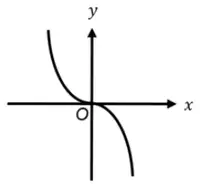
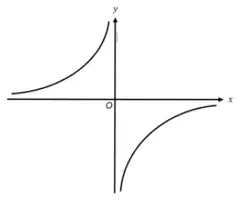
Higher November 2023 Unit 2 Q16WJECHigherCurrent spec3 marksDrawing & Using Graphs16.(a) Put a tick next to the graph that represents the equation \(y = -x^3\). [1]☐☐☐☐☐(b) Use the axes below to sketch the graph of \(y = -\dfrac{1}{x}\). [2]Mark scheme (a)Mark scheme (b)Mark scheme (a)SchemeMarksCommentsB1Third boxMark scheme (b)SchemeMarksCommentsCorrect sketch of \(y = -1/x\) in appropriate 2 quadrants with axes as asymptotes with no extra curves in the other quadrants.B2Penalise -1 for the curling away from the asymptotes at the extremities only if B2 previously awarded.If not B2, award B1 for one of the following:Correct sketch in 1 quadrant with axes as asymptotes with no more than 1 incorrect curve in another quadrantCorrect sketch in appropriate 2 quadrants with axes as asymptotes with extra incorrect curves in one or two of the other quadrantsfor two curves sketched appropriately in both quadrants but not clearly with intention of axes as asymptotesCorrect sketch of \(y = +1/x\) in appropriate 2 quadrants with axes as asymptotes.