
Foundation June 2024 Unit 2 Q18
18. The employees of a company belong to one of three departments: Management (M), Sales (S) or Distribution (D).
The diagram below is a sketch of a pie chart.
The diagram shows the proportion of employees working in each of these departments.
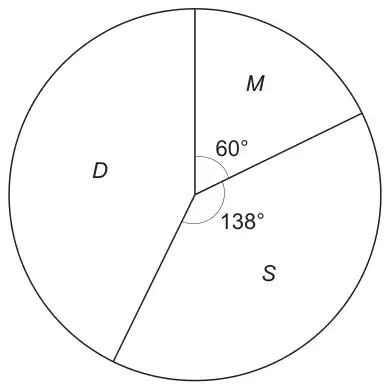
Diagram not drawn to scale
An employee is chosen at random.
Calculate the probability that this employee works in the Distribution department.
Give your answer as a decimal. [3]
| Scheme | Marks | Comments |
|---|---|---|
| (Distribution = 360 – 60 – 138 =) 162(°) | B1 | May be seen on diagram. |
| \(\dfrac{162}{360}\) or \(\dfrac{9}{20}\) or equivalent | M1 | FT \(\dfrac{\underline{\text{`their stated 162'}}}{360}\), provided obtuse. |
| = 0·45 | A1 | Answer must be given as a decimal. Mark final answer. FT provided ‘their fraction’ < 1. If 0·45 seen, but then 45% or \(\dfrac{45}{100}\) or equivalent award B1M1A1. Award B1 M1 A0 for 45% or equivalent (not a decimal) if 0·45 not seen. If no marks, award SC1 for the correctly evaluated decimal equivalent of an answer of \(\dfrac{\underline{\text{`their stated 162'}}}{60 + 138 + \text{`their stated 162'}}\) e.g. \(\dfrac{154}{352} = 0{\cdot}4375\) (angle measured in diagram) An unsupported answer of 0·45 is awarded B1M1A1. |
Alternative method
| Scheme | Marks | Comments |
|---|---|---|
| \(1 - \dfrac{198}{360}\) or \(1 - \dfrac{11}{20}\) or equivalent | M2 | Award M1 for \(1 - \dfrac{\underline{\text{`their 138 + 60'}}}{360}\). |
| = 0·45 | A1 | Answer must be given as a decimal. Mark final answer. FT provided 1 – ‘their fraction < 1’. |