
Foundation November 2024 Unit 1 Q7
7. Mrs Lewis asked each student in Year 11 what kind of music they preferred.
She gave the students three options: Hip Hop, Pop and Rock.
The pie chart below shows the results.
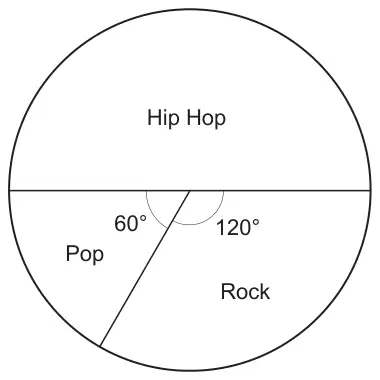
(a) Mrs Lewis chooses one of the students at random.
What is the probability that this student chose Hip Hop? [1]
What is the probability that this student chose Hip Hop? [1]
(b) 45 students chose Hip Hop.
How many students are there in total? [2]
How many students are there in total? [2]
(c) What fraction of these students chose Pop? [2]
| Scheme | Marks | Comments |
|---|---|---|
| \(\dfrac{1}{2}\) or \(\dfrac{180}{360}\) or 50% or equivalent | B1 | ISW Allow (a) half B0 for answer using words alone with no numerical value; e.g. ‘even chance’ alone. |
Corrected by Westie's Workshop
- The board's mark scheme printed “BO for answer using words alone”. Changed to “B0 for answer using words alone” because the mark code is B0 (zero), not the letter O.
Original: see the board's mark scheme PDF (link above).
| Scheme | Marks | Comments |
|---|---|---|
| 2 × 45 | M1 | FT from 45 ÷ ‘their (a)’ |
| 90 | A1 |
| Scheme | Marks | Comments |
|---|---|---|
| \(\dfrac{60}{360}\) or \(\dfrac{1}{6}\) or \(\dfrac{15}{90}\) or equivalent | B2 | ISW B1 for sight of 360° as a denominator. |