
Foundation November 2023 Unit 1 Q10
10. 200 pupils at a school were choosing lunch.
Each pupil could choose peas, carrots or sweetcorn as their vegetable.
Pupils could choose only one vegetable.
The table below shows the probability that a randomly selected pupil chose peas, carrots or sweetcorn.
| Vegetable | Peas | Carrots | Sweetcorn |
|---|---|---|---|
| Probability | 0·5 | 0·2 | 0·3 |
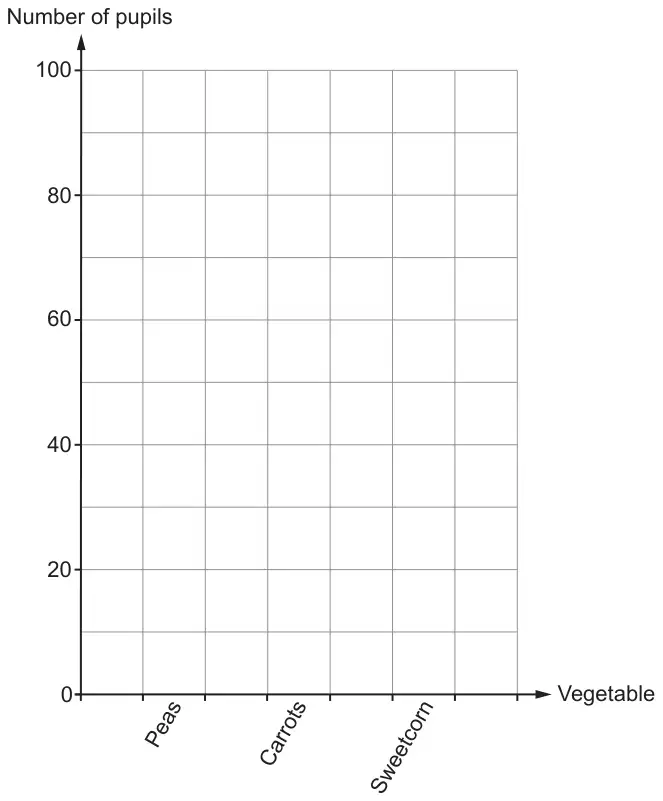
On the grid below, draw a bar chart to show the number of pupils who chose each vegetable. [3]
| Scheme | Marks | Comments |
|---|---|---|
Correctly drawn bar chart.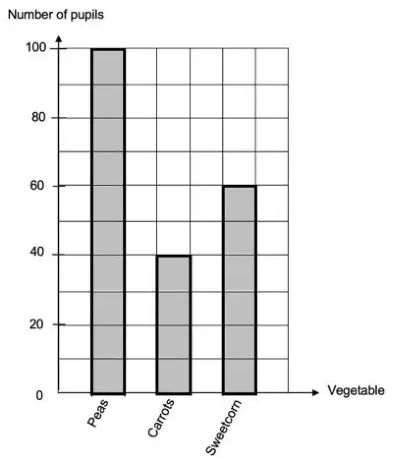 | B3 | Bar widths can be one or two squares and must be consistent. B2 for one of the following:
SC1 for bars of equal width and of height 50, 20, 30 correctly drawn if 0 marks awarded. |