
May 2024 Paper 2 Q4
4. The diagram shows the graph of a quartic function \(y=f(x)\).
A maximum turning point occurs at (−1, 3).
The graph of \(y=f(x)\) also has a point of inflection at \(x=2\).
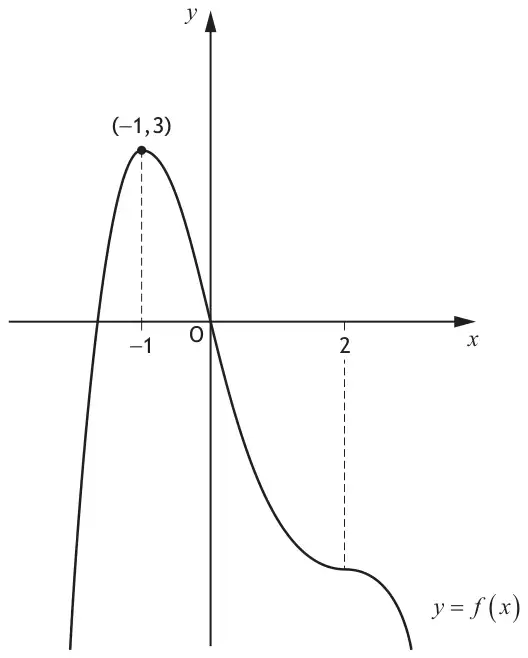
(a) Determine the coordinates of the maximum turning point on the graph of \(y=f(x-4)+2\). [2]
(b) On the diagram below, sketch the graph of \(y=f^{\prime}(x)\). [3]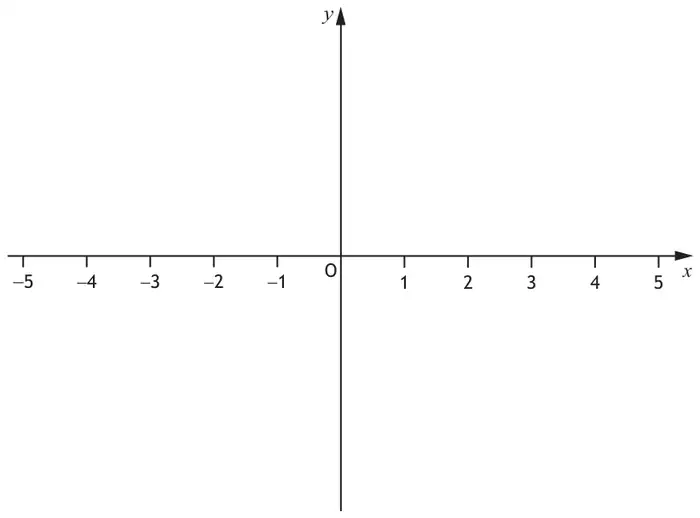
| Mark | Generic scheme | Illustrative scheme |
|---|---|---|
| •1 | identify \(x\)-coordinate | \(3\) |
| •2 | identify \(y\)-coordinate | \(5\) |
| (2) |
| Mark | Generic scheme | Illustrative scheme |
|---|---|---|
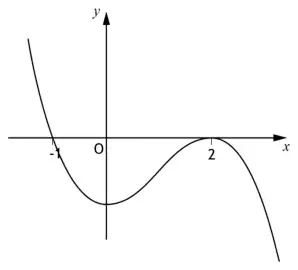
| •3 | identify roots | “cubic” with roots at \(-1\) and \(2\) |
| •4 | interpret point of inflection | “cubic” with turning point at \((2,0)\) |
| •5 | identify orientation and complete cubic curve | cubic with maximum turning point at \((2,0)\)
|
| (3) |
Notes:
- Note that the position of the minimum turning point of \(f^{\prime}(x)\) is not being assessed.
- Where a candidate has not drawn a cubic curve or their graph does not extend outwith \(-1\leqslant x\leqslant 2\) award 0/3. However see Candidate D.
- Do not penalise the appearance of an additional root outwith \(-1\leqslant x\leqslant 2\) (on a cubic curve) at •3.
Commonly Observed Responses:
Candidate A - \(-f^{\prime}(x)\)
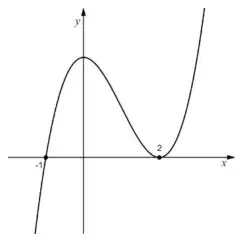
✓ ✓ ✗
Candidate B
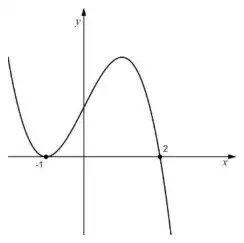
✓ ✗ ✗
Candidate C
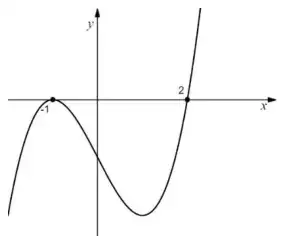
✓ ✗ ✗
Candidate D - left derivative ≠ right derivative at (2,0)
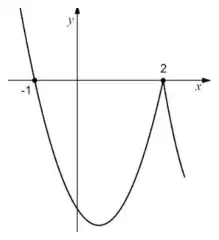
✓ ✓ ✗