
AS June 2022 Further Unit 2 Q7
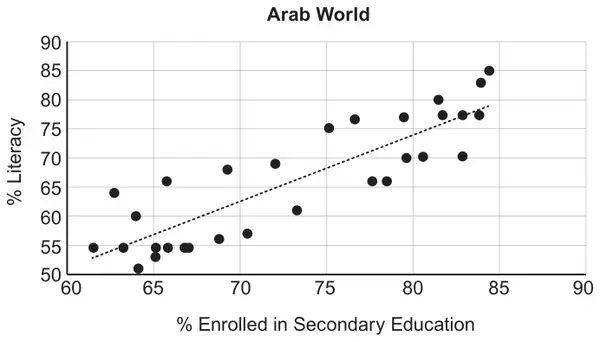
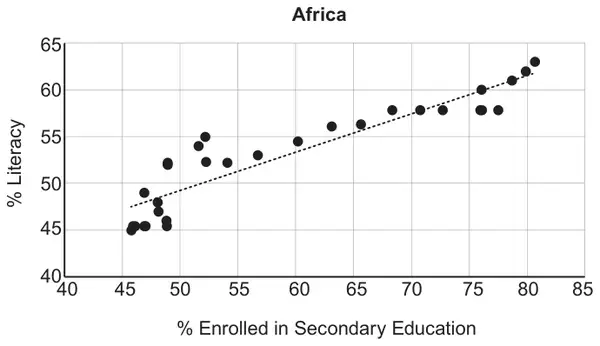
7. Data from a large dataset shows the percentage of children enrolled in secondary education and the percentage of the adult population who are literate. The following graphs show data from 30 randomly selected regions from each of the Arab World, Africa and Asia. In each case, the least squares regression line of ‘% Literacy’ on ‘% Enrolled in Secondary Education’ is shown.
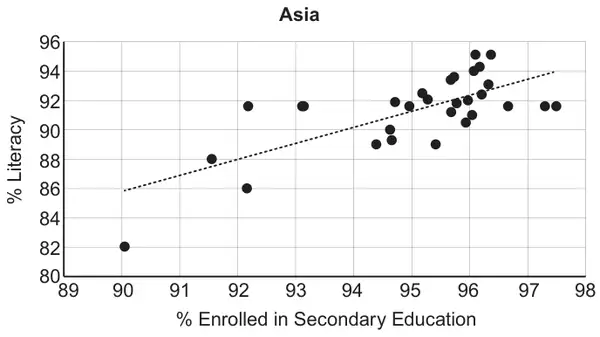
(a) Calculate the equation of the least squares regression line of ‘% Literacy’ (\(y\)) on ‘% Enrolled in Secondary Education’ (\(x\)) for Asia, given the following summary statistics. [5]\[\textstyle\sum x=2850{\cdot}836\qquad\sum y=2738{\cdot}656\qquad S_{xx}=88{\cdot}42142\]\[S_{yy}=204{\cdot}733\qquad S_{xy}=96{\cdot}60984\qquad n=30\]
(b) The Arab World, Africa and Asia each contain a region where 70% are enrolled in secondary education. The three regression lines are used to estimate the corresponding % Literacy. Which of these estimates is likely to be the most reliable? Clearly explain your reasoning. [2]
| Scheme | Marks | Comments |
|---|---|---|
| \(b=\dfrac{96.60984}{88.42142}\) | M1 | |
| \(b=1.09(26\ldots)\) | A1 | Accept 1.1 |
| \({a=\dfrac{2738.656}{30}-1.09(26\ldots)\times\dfrac{2850.836}{30}}\) | M1 | FT their ‘\(b\)’ for M1 |
| \(a=\text{-}12.5(39\ldots)\) | A1 | FT their ‘\(b\)’, following A0. Answer correct to 3sf |
| \(y=-12.5+1.09x\) | A1 | A1 FT ‘their’ gradient and intercept provided at least one M1 awarded. |
| Scheme | Marks | Comments |
|---|---|---|
| Africa because 70 is out of the data set for Asia, The data points for Africa are closer to a straight line than those for the Arab World. | E1 E1 | |
| Total [7] |