
AS June 2019 Further Unit 2 Q1
1.
(a) Sketch a scatter diagram of a dataset for which Spearman’s rank correlation coefficient is +1, but the product moment correlation coefficient is less than 1. [2]
Two judges were judging cheese at the UK Cheese Festival. There were 8 blue cheeses in a particular category. The rankings are shown below.
| Cheese | A | B | C | D | E | F | G | H |
|---|---|---|---|---|---|---|---|---|
| Judge 1 | 1 | 5 | 8 | 7 | 6 | 4 | 3 | 2 |
| Judge 2 | 1 | 3 | 8 | 5 | 2 | 4 | 6 | 7 |
(b) Calculate Spearman’s rank correlation coefficient for this dataset. [3]
(c) By sketching a scatter diagram of the rankings, or otherwise, comment on the extent to which the judges agree. [2]
| Scheme | Marks | Comments |
|---|---|---|
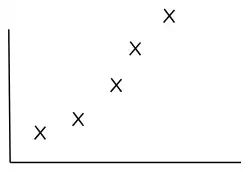 | B2 | B2 Increasing ranks and non linear. At least 3 points. B1 for positive correlation. |
| Scheme | Marks | Comments |
|---|---|---|
| \(\sum d^2=58\) | B1 | |
| \(r_s=1-\dfrac{6\times58}{8\times63}\) | M1 | |
| \(\phantom{r_s}=0.3095\ldots=\frac{13}{42}\) | A1 |
| Scheme | Marks | Comments |
|---|---|---|
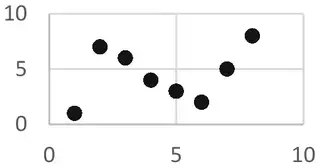 e.g. Both judges agree on the best and worst cheese. e.g. The judges agree on 3 of the 8 cheeses. | E1 | |
| Valid comment on disagreement. e.g But they almost completely disagree about the others. | E1 | |
| Total [7] |