
June 2019 Unit 4 Q5
5. A bowling alley manager in the UK is concerned about falling revenues. He collects data from the United States, hoping to use what he finds to revive his business in the UK.
He finds data which seem to show correlation between margarine consumption and bowling alley revenue. He attempts to carry out some statistical analysis in order to present his findings to the board of directors. He produces the scatter diagram shown below.
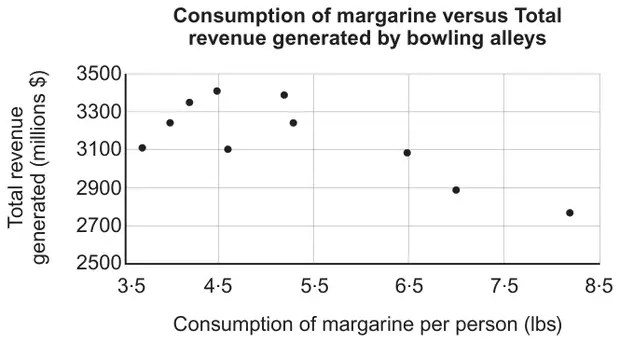
The product moment correlation coefficient for these data is \(-0{\cdot}7617\). He carries out a one-tailed test at the 1% level of significance and concludes that higher margarine consumption is associated with lower revenue generated by bowling alleys.
The manager also conducts a significance test for bowling alley revenue and fish consumption per person. He produces the computer output, shown below, for the analysis of bowling alley revenue versus fish consumption per person.
# Pearson’s product-moment correlation
# data:  revenue and fish
# t = 3.8303, df = 8, p-value = 0.005215
# alternative hypothesis: true correlation is not equal to 0
# sample estimates:
#       correlation
# 0.8024423
| Scheme | Marks | Comments |
|---|---|---|
| \(H_0:\rho=0\qquad H_1:\rho<0\) | B1 | B0 for \(H_0\): correlation = 0. Population must be stated or implied. |
| \(n=10\) | B1 | si |
| \(\text{TS}=-0.7617\) | B1 | B1 for use of or stating as test statistic |
| CV = \((\pm)\) 0.7155 | B1 | |
| Since \(|\text{TS}|>\ 0.7155\) (or \(\text{TS}<-0.7155\)), there is sufficient evidence to reject \(H_0\). | B1 |
| Scheme | Marks | Comments |
|---|---|---|
| p-value \(=0.005215\) is less than 0.01 | E1 | Condone any significance level less than or equal to 0.1 |
| Bowling alley revenue is (positively) correlated with fish consumption per person. | E1 | Do not allow weak correlation |
| The correlations, despite being significant, seem irrelevant in both cases and therefore the board of directors should not implement any suggestions made by the manager based on his calculations. | E1 | Award E1 for a comment that implies the board of directors should do nothing, or that the correlations are irrelevant with a reasonable course of action. Do not allow “the bowling alley should sell more fish and less margarine” Do not allow board of directors should do nothing because there is not correlation. |
| Scheme | Marks | Comments |
|---|---|---|
| Valid comment. e.g. It is unclear what each data point represents. e.g. He has carried out the tests without considering how irrelevant the findings may be. e.g. It’s unclear whether this data is a sample, so no inferences can be made. e.g. It’s not clear what the population is. e.g. The data is not bivariate normal | E1 | |
| [9] |