
June 2018 Unit 4 Q5
5. Rebecca is a farmer who is monitoring prices for products to use on her farm. She records the prices of two products made from different grains, wheat and oats, at random points in time, to investigate whether there is any correlation.
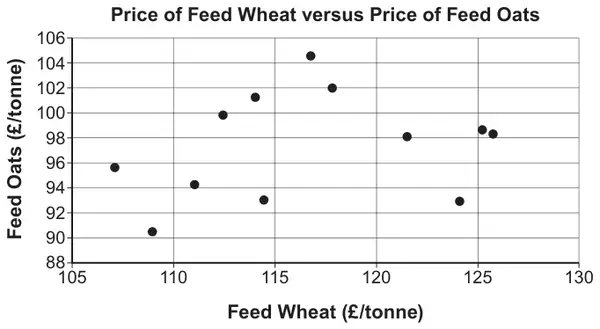
The product moment correlation coefficient for the data is 0·244. There are 12 data points, and the \(p\)-value is 0·4447.
(a) Comment on the correlation between the prices of Feed Wheat and Feed Oats. [2]
Rebecca also records the prices of two wheat products at random points in time, to investigate whether there is any correlation.
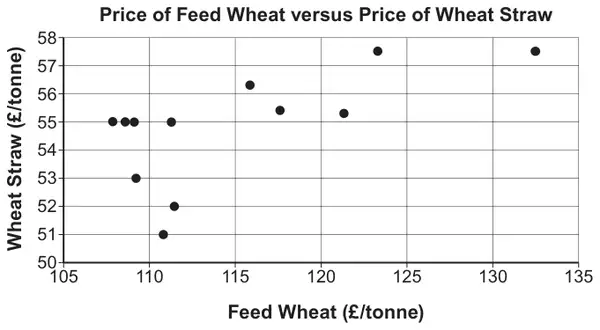
The product moment correlation coefficient for the data is 0·653. There are 12 data points.
(b) Stating your hypotheses clearly, test at the 5% level of significance whether there is any evidence of correlation between the prices of these two products. [5]
(c) Without referring to the positioning of the points on the graphs, suggest why the product moment correlation coefficient is higher for the second set of data. [1]
| Scheme | Marks | Comments |
|---|---|---|
| p- value for ‘Feed Wheat’ versus ‘Feed Oats’ > 0.05 | E1 | |
| Price of Feed Wheat does not seem to be correlated with price of Feed Oats | E1 |
| Scheme | Marks | Comments |
|---|---|---|
| H0: \(\rho\) = 0 H1: \(\rho\neq 0\) | B1 | H0: \(\rho\) = 0 H1: \(\rho\) > 0 |
| TS = 0.653 CV = 0.5760 Since TS>0.5760 Reject H0. Sufficient evidence to suggest there is a correlation between the prices of feed wheat and wheat straw. | B1 B1 B1 E1 | TS = 0.653 CV = 0.4973 Since TS>0.4973 Reject H0. Strong evidence to suggest there is a positive correlation between the prices of feed wheat and wheat straw. |
| Scheme | Marks | Comments |
|---|---|---|
| Appropriate comment implying understanding that the second graph is comparing two wheat products whereas the first is comparing different grains. | E1 | |
| [8] |