
June 2018 Unit 2 Q5
5. A baker is aware that the pH of his sourdough, \(y\), and the hydration, \(x\), affect the taste and texture of the final product. The hydration is measured in ml of water per 100 g of flour (ml / 100 g). The baker researches how the pH of his sourdough changes as the hydration changes.
The results of his research are shown in the diagram below.
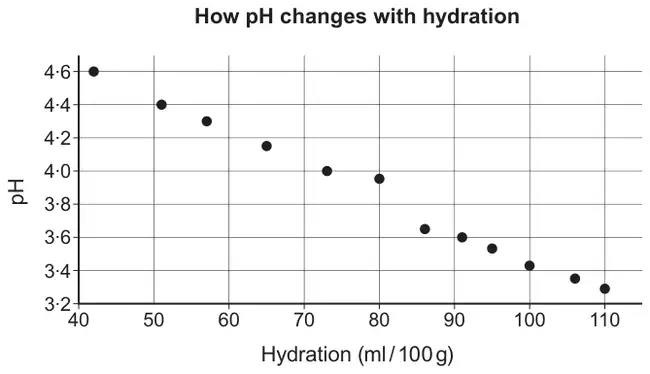
(a) Describe the relationship between pH and hydration. [2]
(b) The equation of the regression line for \(y\) on \(x\) is \[y=5{\cdot}4-0{\cdot}02\,x.\]
(i) Interpret the gradient and intercept of the regression line in this context.
(ii) Estimate the pH of the sourdough when the hydration is 20 ml / 100 g.
Comment on the reliability of this estimate. [4]
Comment on the reliability of this estimate. [4]
| Scheme | Marks | Comments |
|---|---|---|
| Strong linear relationship | E1 | |
| The higher the hydration the lower the pH. | E1 |
| Scheme | Marks | Comments |
|---|---|---|
| (i) Each additional ml of water per 100g of flour decreases the pH by 0.02 on average. | E1 | Or equivalent |
| The intercept would imply that at zero hydration the pH would be 5.4. | E1 | |
| (ii) \(y=5.4-0.02\times20\) | ||
| \(y=5\) | B1 | From use of regression line. |
| Any correct comment. e.g. Outside the data set Extrapolation, etc. | E1 | |
| [6] |