
June 2022 Unit 2 Q6
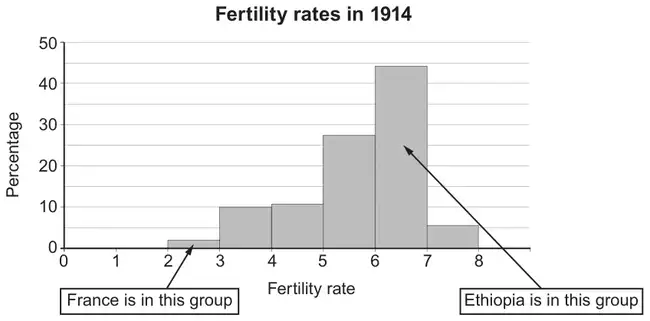
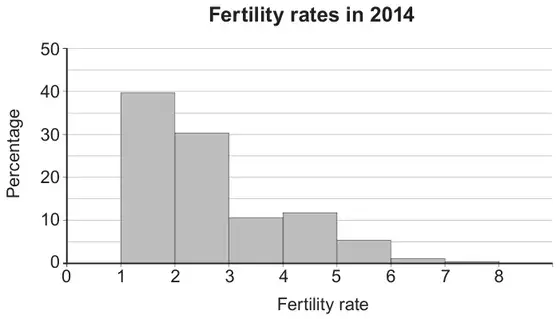
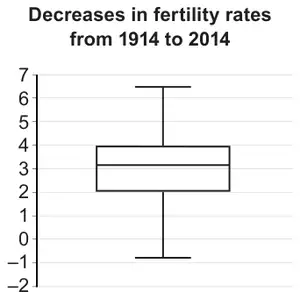
6. The fertility rate for a country is the average number of children that are born to a woman over her lifetime. The graphs and table below show some data on the fertility rates for 197 countries in the years 1914 and 2014.
| Decreases in fertility rates from 1914 to 2014, \(n\) = 197 | |
|---|---|
| Minimum value | –0·71 |
| Lower quartile | 2·08 |
| Median | 3·19 |
| Upper quartile | 3·94 |
| Maximum value | 6·49 |
(a) Comment on the shapes of the distributions of fertility rates for 1914 and 2014. [2]
(b) Interpret the minimum value, –0·71, in the boxplot. [1]
You are also given the following information:
| Country | Fertility rate for 1914 | Fertility rate for 2014 |
|---|---|---|
| France | Between 2 and 3 | 1·98 |
| Ethiopia | Between 6 and 7 | 4·4 |
(c)
(i) Find the best possible estimate for the decrease in the fertility rate from 1914 to 2014 for France.
(ii) Find the best possible estimate for the decrease in the fertility rate from 1914 to 2014 for Ethiopia.
(iii) Give one possible reason why the answers to i) and ii) are so different.
(iv) Explain why these estimates may not be very accurate. [5]
| Scheme | Marks | Comments |
|---|---|---|
| Two valid comments. e.g. 1914 is negatively skewed. 2014 is positively skewed. Fertility rates were larger in 1914 than 2014 on average. | E2 | Condone 1914 is skewed to the left. 2014 is skewed to the right. Allow “people tended to have more children in 1914 than in 2014”. E1 for each valid comment. |
| Scheme | Marks | Comments |
|---|---|---|
| That fertility rates are increasing in (at least) one country i.e., women had more babies on average in 2014 than 1914 in that country. | E1 | E0 for decreasing by -0.71. |
Corrected by Westie's Workshop
- The board's mark scheme printed “E0 for decreasing by -0.61.”. Changed to “E0 for decreasing by -0.71.” because the minimum value in the question is −0·71, so the example of a wrong answer should quote that value.
Original: see the board's mark scheme PDF (link above).
| Scheme | Marks | Comments |
|---|---|---|
| (i) Attempt to find decrease for either. | M1 | Do not allow values other than 2.5 and 6.5 without a valid justification. |
| Approximately \(2.5-1.98=0.52\) | A1 | Allow in percentage terms i.e., France fell by 20.8% |
| (ii) Approximately \(6.5-4.4=2.1\) | A1 | Allow in percentage terms, i.e., Ethiopia fell by 32.3% |
| (iii) Valid reason must address the decrease. e.g., Countries with a higher fertility rate in 1914 have more of an opportunity for it to decrease. e.g., Ethiopia is a developing country and its fertility rate is likely to have decreased more rapidly in the last 100 years than France which is a developed country. | E1 | Do not allow comparison of birth rates in both countries. |
| (iv) Valid explanation. e.g., We have used the midpoint of the group to estimate. e.g., We have no way of knowing what the exact fertility rates of France and Ethiopia are in 1914. e.g., Exact fertility rates in 1914 are unknown. | E1 | Allow responses that imply that the fertility rate may not have been measured accurately, e.g., data collection methods may differ between the countries or across the 100 years. |
| Total [8] |