
Higher November 2019 Paper 2 Q15
15. The velocity-time graph below shows the first 60 seconds of a car’s journey.
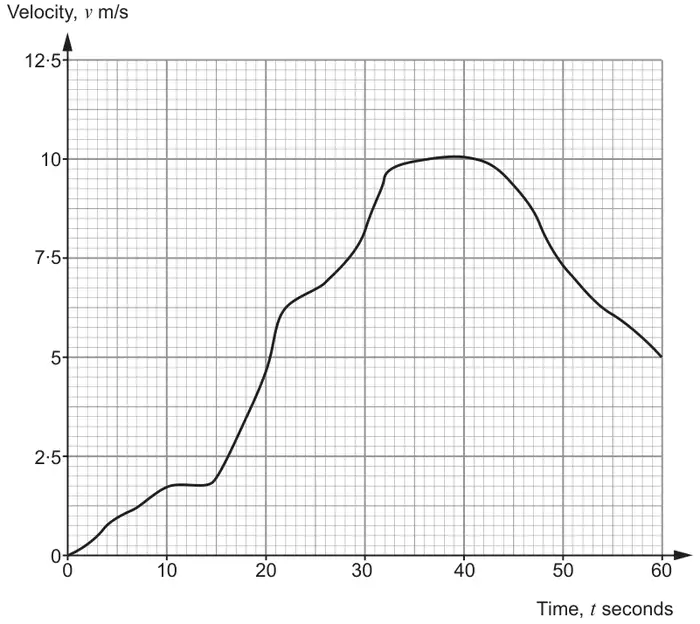
(a) After how many seconds was the velocity of the car 9 km/h? [4]
(b) Harriet argues that the acceleration at \(t = 22\) represents the typical acceleration of the car during the first 32 seconds of this period.
Explain why Harriet’s argument is correct. [1]
(c) Over the same 60 seconds, the velocity, \(v\) m/s, at time, \(t\) seconds, of another car is given by the following equation.\[v = 7 + \frac{t^2}{1000}\]
Find two times for which the difference in the two cars’ velocities was 2·5 m/s.
Give these times correct to the nearest second.
You must show all your working. [4]
| Scheme | Marks | Comments |
|---|---|---|
| \((9) \div 60 \div 60\) | M1 | |
| \(\times 1000\) | M1 | |
| Reading from graph 16 (seconds) | A2 | FT from ‘their 2.5(m/s)’ provided at least M1 previously awarded A1 for 2.5(...m/s) |
| Scheme | Marks | Comments |
|---|---|---|
| Reasonable statement, e.g. ‘tangent at \(t = 22\) is almost parallel to the gradient during this period’ | E1 | Do not accept, e.g. ‘positive gradient’ Allow, e.g. ‘gradient of the tangent is positive’, ‘the tangent follows the trend’ |
| Scheme | Marks | Comments | ||||||||||||||||
|---|---|---|---|---|---|---|---|---|---|---|---|---|---|---|---|---|---|---|
| Attempt to find at least one point, i.e. value of \(v\) for \(0 \lt t \leqslant 60\) | S1 |
| ||||||||||||||||
| At least 2 correct plots or 2 appropriate values of \(v\) | P1 | |||||||||||||||||
| Suitable curve between 10 and 60, or 3 values of \(v\) evaluated in the interval \(10 \leqslant t \leqslant 60\), | C1 | |||||||||||||||||
| Two times with difference of 2.5 m/s | B1 | (20 and 51 seconds, allow 20 and 50 seconds) | ||||||||||||||||
| (9) |