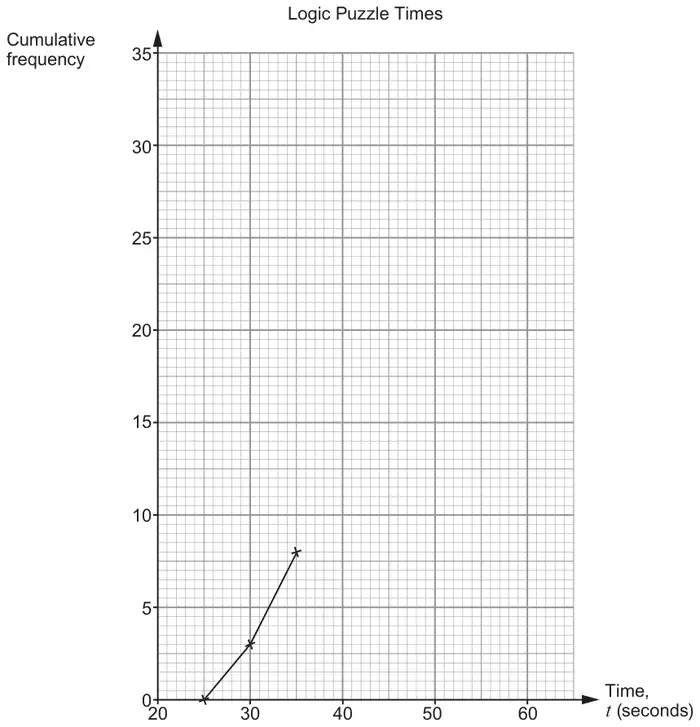
13. The table shows a summary of the time, in seconds, it takes each of 32 people to complete a logic puzzle.
Time, \(t\) (seconds)
\(t \leqslant 25\)
\(t \leqslant 30\)
\(t \leqslant 35\)
\(t \leqslant 40\)
\(t \leqslant 45\)
\(t \leqslant 50\)
\(t \leqslant 55\)
\(t \leqslant 60\)
Cumulative frequency
0
3
8
16
21
24
29
32
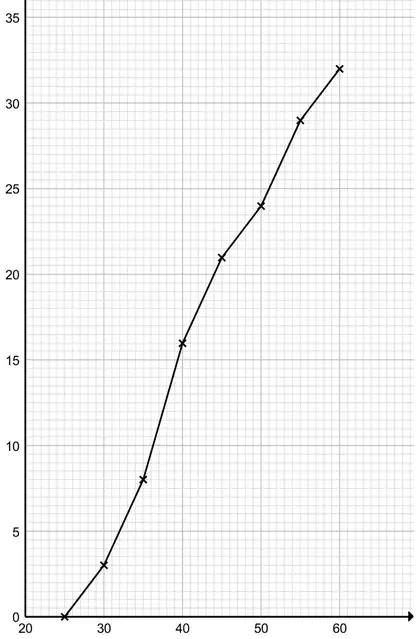
(a) Complete the cumulative frequency diagram below to show these results. [2]
(b)
(i) How many people took more than 40 but not more than 50 seconds to complete the puzzle? [1]
(ii) Complete the inequality to show the modal class. [1]
.................... \(\lt t \leqslant\) ....................
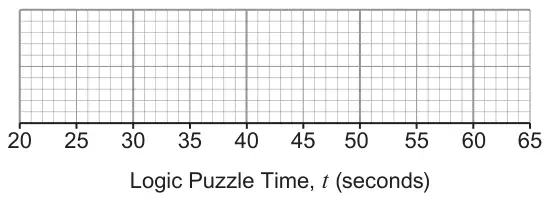
(c) Eddie uses the data from part (a) to obtain estimates and draw a box plot.
He also knows that the fastest time is 26 seconds. Eddie also assumes that the slowest time is 60 seconds.
(i) Draw Eddie’s box plot. [4]
(ii) Explain why Eddie’s assumption may not be correct. [1]
(iii) Eddie’s assumption is not actually correct. What effect does this have on each of the range and the interquartile range? [2]
Mark scheme (a)
Scheme
Marks
Comments
B2
40
45
50
55
60
16
21
24
29
32
B1 for remaining points plotted correctly B1 for all remaining correctly-plotted points joined correctly with straight lines or a smooth curve and no extension beyond (60, 32)
If no marks, award SC1 for at least 4 points plotted correctly and joined with straight lines or a smooth curve and no extension beyond (60, 32)
Mark scheme (b)
Scheme
Marks
Comments
(i) 8
B1
or FT ‘their CF diagram’
(ii) 35 40
B1
or FT ‘their CF diagram’
Mark scheme (c)
Scheme
Marks
Comments
(i) Box plot with ends of whiskers at 26 and 60
B1
LQ 35
B1
or FT ‘their CF diagram’
Median 40
B1
or FT ‘their CF diagram’
UQ 50
B1
or FT ‘their CF diagram’
(ii) Valid explanation e.g. ‘The slowest time could be anything between 55 and 60.’ or ‘The slowest time could be 58 seconds.’
E1
Must include idea of ‘less than’.
Allow ‘The slowest time could be less than 60.’
Do not allow e.g. ‘We do not know that anyone took 60 seconds.’ (no idea of less than)
(iii) Valid effect on the range e.g. The (actual) range will be smaller.
E1
Allow e.g. ‘It will be smaller.’ or ‘Eddie’s range is bigger than it should be’.
Do not allow e.g. ‘It makes it bigger.’ without reference to this being a comment about Eddie’s range.
Valid effect on the IQR e.g. The IQR will not change.
We'd like to use Google Analytics cookies to count visits and see which pages help most. They're optional, and the site works exactly the same either way. Privacy policy