15. Sita is investigating the popularity of two social media websites, A and B.
She asked 60 technology students how much time they each spent using social media website A yesterday. The table summarises the data she collected.
Time spent, \(t\) (minutes)
\(t \leqslant 20\)
\(t \leqslant 30\)
\(t \leqslant 40\)
\(t \leqslant 50\)
\(t \leqslant 60\)
\(t \leqslant 70\)
\(t \leqslant 80\)
Cumulative frequency
0
5
25
45
52
58
60
(a) How many students spent more than 60 minutes using social media website A? [1]
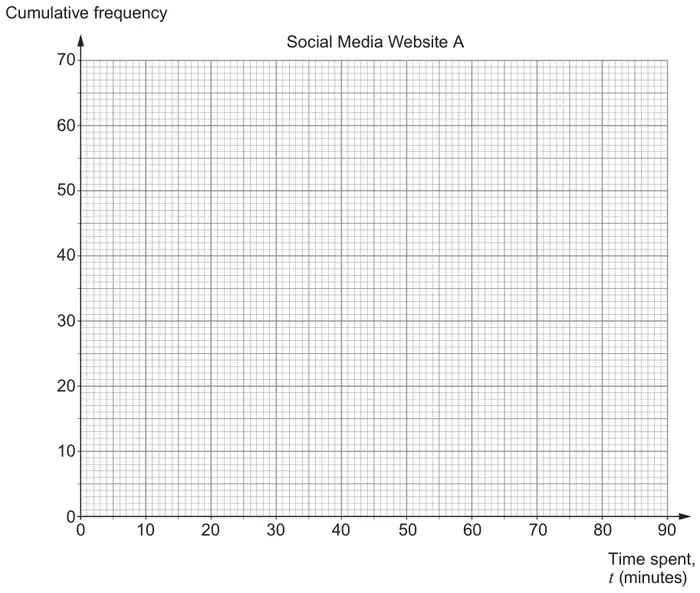
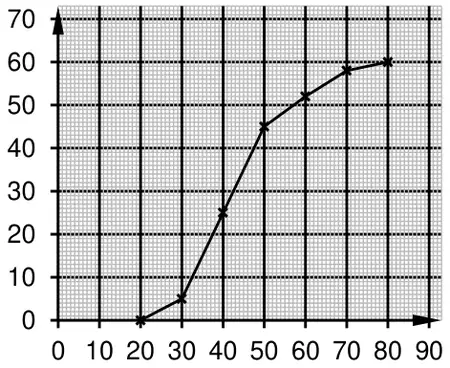
(b) Draw a cumulative frequency diagram to represent Sita’s information. [3]
(c) Use your diagram to find an estimate of the median time and the interquartile range of the times the students spent using social media website A. [3]
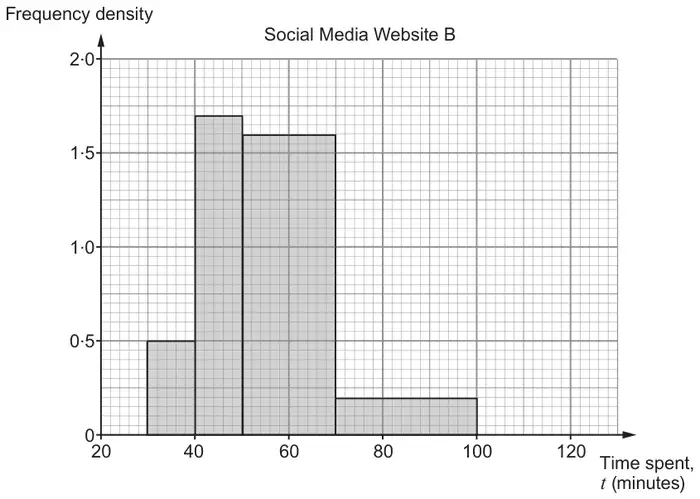
(d) Sita asked the same 60 technology students how much time they each spent using social media website B yesterday. She used her data to draw the histogram shown below.
(i) Calculate an estimate for the difference between the number of students who use social media website B for more than 60 minutes and those who use social media website A for more than 60 minutes. [3]
(ii) Sita uses her results to state which social media website is more popular. Is her conclusion likely to be reliable? Explain how you decide. [1]
Mark scheme (a)
Scheme
Marks
Comments
8
B1
Mark scheme (b)
Scheme
Marks
Comments
7 points plotted correctly
B2
B1 for 5 or 6 points plotted correctly tolerance ± 1mm
All points joined with a smooth curve or with line segments
B1
last point must not be joined to the axis; tolerance ± 1mm
Mark scheme (c)
Scheme
Marks
Comments
(median =) 42 to 43
B1
FT ‘their attempt at a cf diagram’
(IQR =) \(50 - 35\)
M1
FT ‘their graph’ for lower quartile; Upper quartile must be exact as it is a given value
15
A1
Mark scheme (d)
Scheme
Marks
Comments
(i) 22
B2
Award B1 for \(\tfrac12 \times 20 \times 1.6\) or \(30 \times 0.2\) or sight of 16 or 6
If B0 then SC1 for misreading scale, \((\tfrac12 \times 20 \times 1.7 + 30 \times 0.4 =)\ 29\)
\((22 - 8 =)\ 14\)
B1
FT ‘their 22’ – ‘their 8’ from part (a); provided at least one mark previously awarded
(ii) Valid explanation e.g. ‘No as she has not asked sufficient people.’ or ‘No as she has only asked technology students.’ or ‘She only asked them about 1 day’
We'd like to use Google Analytics cookies to count visits and see which pages help most. They're optional, and the site works exactly the same either way. Privacy policy