
Higher November 2018 Paper 1 Q1
1. The scatter diagram shows the height and mass of 10 dogs.
These dogs are all West Highland Terriers.
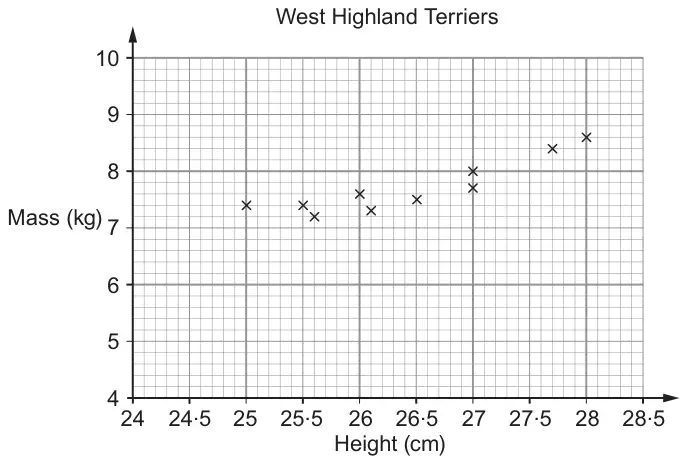
(a) Draw a line of best fit on the scatter diagram. [1]
(b) Estimate the mass of a West Highland Terrier that has a height of 26·7 cm. [1]
(c) Another dog has a mass of 8·2 kg and a height of 35 cm.
Is this dog likely to be a West Highland Terrier?
Is this dog likely to be a West Highland Terrier?
Yes ☐ No ☐
Explain your answer. [1]| Scheme | Marks | Comments |
|---|---|---|
| Correct line of best fit | B1 | Following trend with some points above and below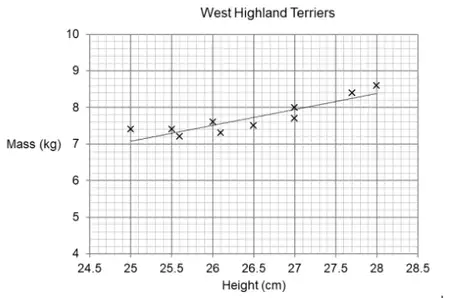 |
| Scheme | Marks | Comments |
|---|---|---|
| Answer in the range 7.5 to 8 (kg) | B1 | Or FT their line for an answer outside this range |
| Scheme | Marks | Comments |
|---|---|---|
| No with valid reason e.g. ‘It is too tall’ or ‘A dog of mass 8.2 kg should have a height of about 27.5 cm’ | E1 | Allow e.g. ‘For a dog of 35 cm, 8.2 kg is not heavy enough.’ or ‘Its height does not match its weight.’ Allow e.g. ‘It is too far off the line of best fit.’ provided B1 has been awarded in (a). |
| (3) |