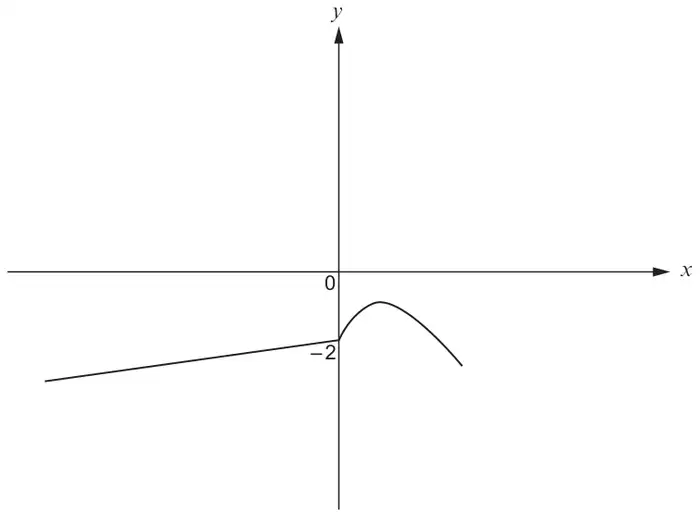
On the same diagram, sketch the curve \(y = -f(x)\). Mark clearly the coordinates of any point where this curve crosses an axis. [2]
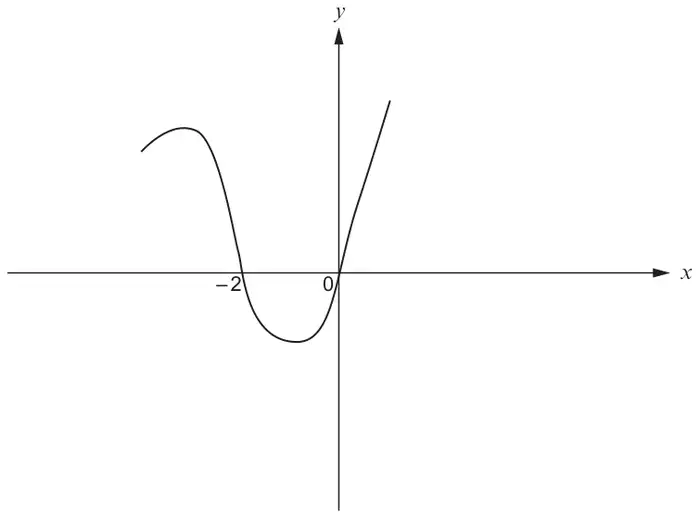
(b) The diagram shows a sketch of \(y = g(x + 2)\).
On the same diagram, sketch the curve \(y = g(x - 1)\). Mark clearly the coordinates of the points where this curve crosses the \(x\)-axis. [3]
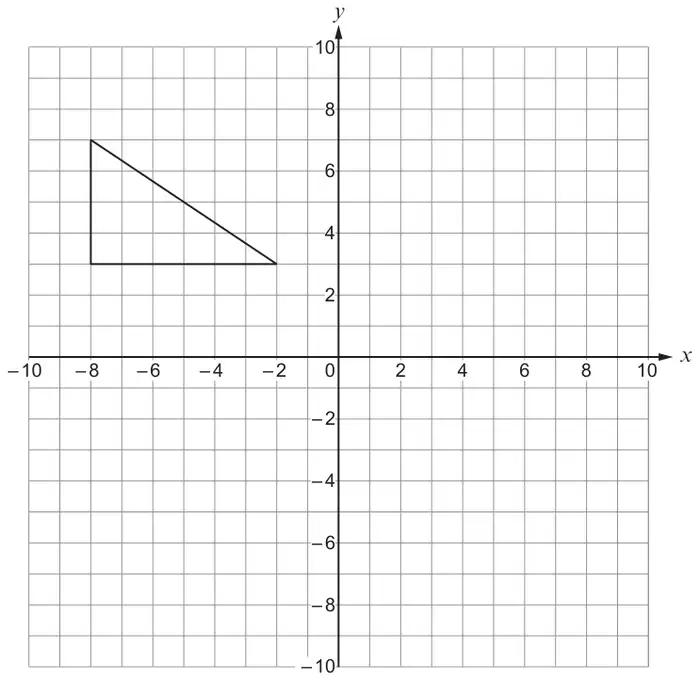
(c) Enlarge the triangle, shown on the grid below, by a scale factor of \(-\frac{1}{2}\) with \((2, 1)\) as the centre of the enlargement. [2]
Mark scheme (a)
Scheme
Marks
Comments
Reflection in the \(x\)-axis
M1
\((0, 2)\)
A1
Accept 2 indicated correctly on the \(y\)-axis
Mark scheme (b)
Scheme
Marks
Comments
Horizontal translation
B1
Any horizontal translation without including any other transformation
Correct translation with \((1, 0)\) and \((3, 0)\) indicated on the \(x\)-axis
B2
Accept indication of 1 and 3 on the \(x\)-axis with the correct translation
B1 for a correct translation with only one of the values 1 and 3 indicated, or for a horizontal translation with \((-1, 0)\) and \((1, 0)\) indicated on the \(x\)-axis as intersections, or for a horizontal translation to show \(y = g(x)\) with \((0, 0)\) and \((2, 0)\) indicated on the \(x\)-axis as intersections
Mark scheme (c)
Scheme
Marks
Comments
Correct negative enlargement
B2
B1 an enlargement with scale factor \(-\frac12\), with correct orientation with incorrect placement.
We'd like to use Google Analytics cookies to count visits and see which pages help most. They're optional, and the site works exactly the same either way. Privacy policy