
Higher June 2019 Paper 2 Q14
14. The graph below shows the water level in a container from 13:00 to 14:00.
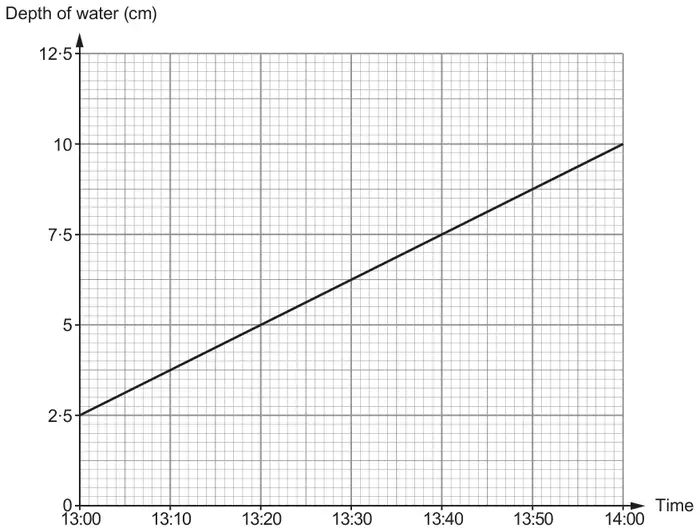
(a) Calculate the rate of the increase in the depth of water in the container.
Give your answer in cm/min. [2]
Give your answer in cm/min. [2]
(b)
(i) If the depth of water in the container continues to rise at the same rate, what would be the height of the water in the container at 15:20? [1]
(ii) Why may it not be sensible to state the height of the water in the container at 17:00? [1]
| Scheme | Marks | Comments |
|---|---|---|
| Method to find the rate, e.g. 7.5 cm per hour, or 1.25 cm per 10 minutes | M1 | |
| 0.125 (cm/min) | A1 |
| Scheme | Marks | Comments |
|---|---|---|
| (b)(i) 20 (cm) or 200 (mm) | B1 | CAO. If units are given they must be correct |
| (b)(ii) Statement, e.g. ‘container might overflow’, ‘may not continue at the same rate’, ‘cross section of the container might change’ | E1 | |
| (4) |