1. Cherie is in charge of marketing for a tourist attraction.
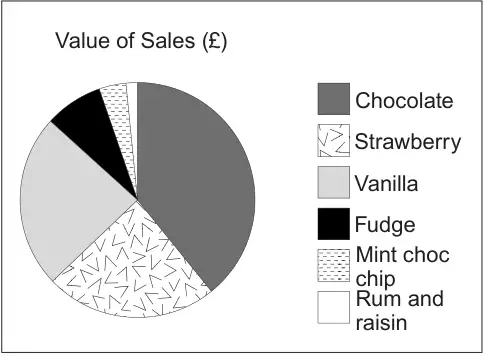
(a) One weekend, she collects some data about the value of ice cream sales from the café. She records her data in a table and uses it to draw a pie chart.
Ice cream flavour
Value of sales (£)
Chocolate
500
Strawberry
300
Coffee
0
Vanilla
300
Fudge
100
Green tea
0
Mint choc chip
50
Rum and raisin
20
State one criticism of the use of a pie chart to display her data. [1]
(b) Cherie also records the number of visitors to the tourist attraction each season for 4 years. Her results are shown in the table.
Season
Winter
Spring
Summer
Autumn
Visitors (thousands)
2015
9
14
19
13
2016
9
13
17
12
2017
6
11
14
9
2018
4
8
15
10
Comment on the trend in the annual number of visitors shown by the data in the table. [1]
Mark scheme (a)
Scheme
Marks
Comments
Valid comment e.g. ‘Some of the data is lost’ or ‘There are too many categories for a pie chart’ or ‘It does not show coffee and green tea’
E1
Allow e.g. ‘It does not show the value of sales’
Mark scheme (b)
Scheme
Marks
Comments
Valid comment e.g. ‘The number of visitors seems to be decreasing’ or ‘The annual number is going down.’
E1
Ignore embellishments/superfluous comments about seasons.
Allow e.g. ‘From 2015 to 2018 the numbers have decreased.’
We'd like to use Google Analytics cookies to count visits and see which pages help most. They're optional, and the site works exactly the same either way. Privacy policy