25. An engineer collects data about the velocity of a vehicle to check its performance.
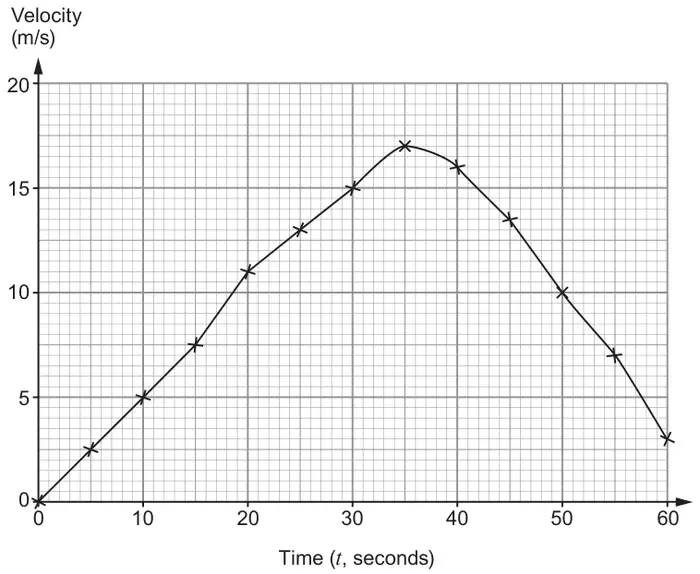
The engineer draws a graph to show the velocity of the vehicle, in metres per second, \(t\) seconds after it begins to move. Her graph is shown below.
(a) The engineer then
draws a tangent to the curve at the point where \(t = 40\)
finds the gradient of the tangent.
What information has she estimated by carrying out this process? [1]
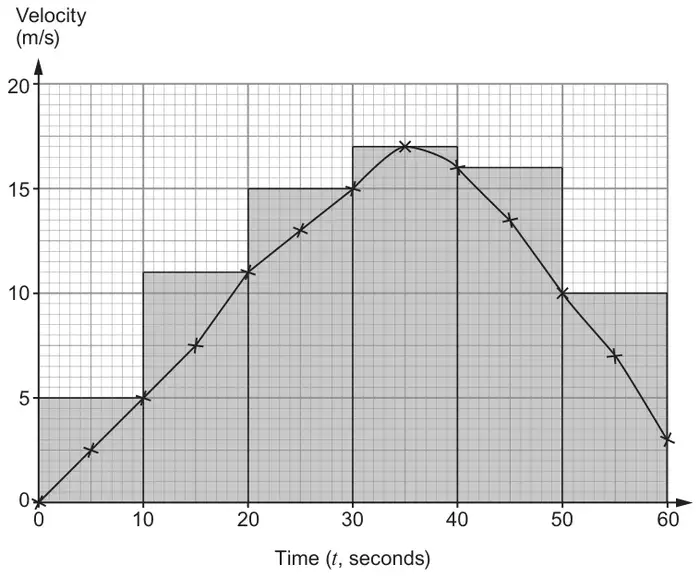
(b) She estimates the distance travelled by the vehicle by summing the areas of rectangles.
Her rectangles are shown on the graph and her answer is 740 metres.
(i) Explain why her method does not give a very good estimate of the distance travelled. [1]
(ii) Suggest a change that she could make to her method to improve her answer. [1]
Mark scheme (a)
Scheme
Marks
Comments
Valid comment e.g. ‘An estimate of the acceleration (at 40 seconds).’ or ‘How fast the vehicle was accelerating (at 40 seconds).’
E1
Allow acceleration or deceleration only without reference to ‘at 40 seconds’.
Allow e.g. ‘How fast the vehicle was decelerating (at 40 seconds).’
Mark scheme (b)
Scheme
Marks
Comments
(i) Valid explanation e.g. ‘The rectangles are all bigger than the area they are estimating.’ or ‘The rectangles she has chosen give an overestimate.’ or ‘The area is overestimated.’ or ‘It is an overestimate.’
E1
(ii) Valid improvement e.g. ‘She could use some triangles as well as rectangles.’ or ‘She could use trapezia.’ or ‘She could use thinner rectangles.’ or ‘She could lower the height of the first 3 and the last 2 bars so that the top went through a cross.’ or ‘She could use the trapezium rule.’
E1
Check diagram for information to further explain their comment e.g. drawing the positions of new rectangles
We'd like to use Google Analytics cookies to count visits and see which pages help most. They're optional, and the site works exactly the same either way. Privacy policy