6.The Shorts Hut is a shop that sells sports clothing and has a customer café.
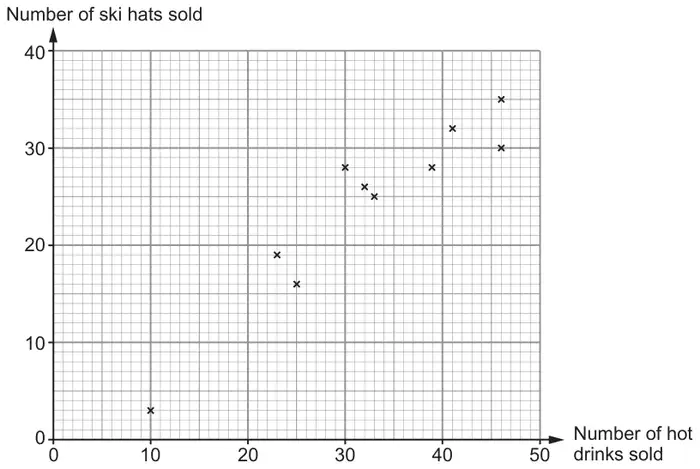
(a) The manager plots some sales data in a scatter graph.
The graph shows the number of hot drinks sold and the number of ski hats sold each day for 10 days.
The manager says that this graph shows that an increase in the sale of hot drinks causes an increase in the sale of ski hats because the correlation is positive.
Explain why the manager is incorrect. [1]
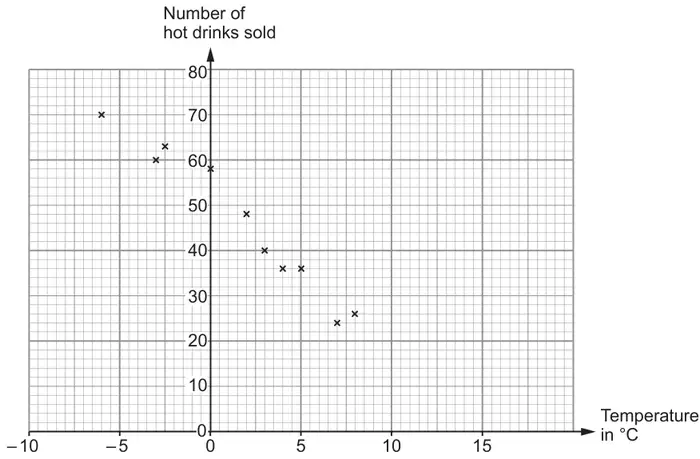
(b) The manager plots another scatter graph showing the temperature, in °C, at 9 a.m. and the number of hot drinks sold during the first hour on each of 10 days.
(i) Draw a line of best fit on the scatter graph. [1]
(ii) Estimate the number of hot drinks the café will sell when the temperature is 6°C. [1]
(iii) Comment on how suitable the graph is for estimating the number of hot drinks sold when the temperature is more than 17°C. You must give a reason for your answer. [1]
Mark scheme (a)
Scheme
Marks
Comments
Valid explanation e.g. ‘Correlation does not imply causation.’ or ‘The manager has confused correlation with causation.’ or ‘Something else may have made the number of hat and hot drinks increase together, such as the weather getting colder.’
E1
Allow e.g. ‘Both increased over 10 days but not because of each other’ or ‘The graph does not provide evidence that one has caused the other, there could be a common cause for the two.’
Mark scheme (b)
Scheme
Marks
Comments
(i) Correct line of best fit drawn
B1
Following trend with points above and below; must be ruled
(ii) Answer in the range 28 to 33
B1
FT ‘their line of best fit’
(iii) Valid comment e.g. ‘It will give a negative number of drinks.’ or ‘It may not be very accurate as there is not much data.’ or ‘Even though the correlation is negative, you cannot be sure of the pattern.’ or ‘Other things may influence the sale of the drinks besides the weather so it may not be very accurate.’ or ‘It is outside the data given.’
E1
Do not accept ‘Not suitable at all’ without justification.
Accept comments that imply e.g. the relationship is not linear.
Allow e.g ‘It is only based on findings from 10 days’
Do not allow e.g. ‘Not suitable as not enough information’
We'd like to use Google Analytics cookies to count visits and see which pages help most. They're optional, and the site works exactly the same either way. Privacy policy