
Foundation November 2019 Paper 1 Q7
7.
(a)
For five days in winter, the lowest temperature in Downdale was recorded.
This information is shown in the table.
| Day | Monday | Tuesday | Wednesday | Thursday | Friday |
|---|---|---|---|---|---|
| Temperature in °C | 2 | 0 | \(-6\) | \(-4{\cdot}5\) | \(-2\) |
(i) Which day was the coldest? [1]
(ii) Work out the difference between the lowest temperature on Monday and the lowest temperature on Thursday. [1]
(iii)
On Saturday, the lowest temperature was 3°C colder than it was on Friday.
What was the lowest temperature on Saturday? [1]
(b) 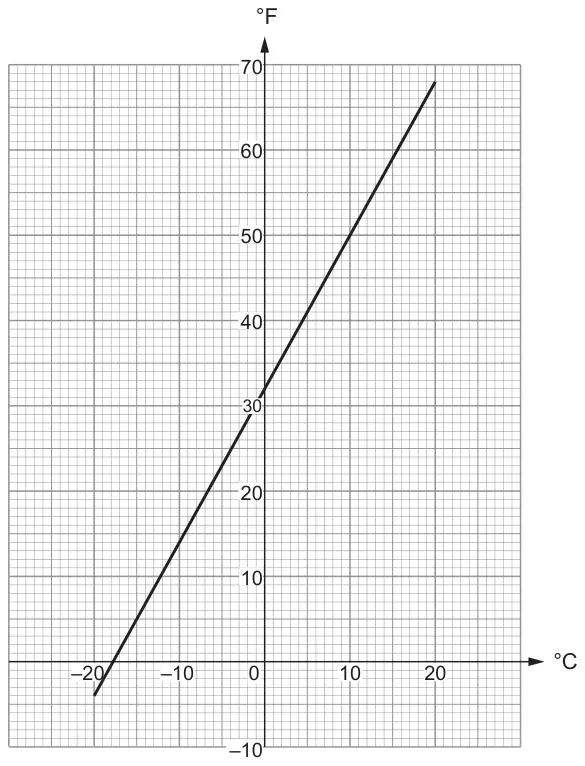
This conversion graph may be used to change between temperatures in degrees Celsius (°C) and temperatures in degrees Fahrenheit (°F).
(i) Use the graph to change 50°F to °C. [1]
(ii) Use the graph to change \(-5\)°C to °F. [1]
(iii)
One day it is 18°C in Bristol and 67°F in New York.
Is Bristol warmer than New York on this day?
Yes ☐ No ☐
Show how you decide. [1]
| Scheme | Marks | Comments |
|---|---|---|
| (i) Wednesday | B1 | Accept any clear indication; B0 for \(-6\) only |
| (ii) 6.5 | B1 | Allow \(-6.5\) |
| (iii) \(-5\) | B1 |
| Scheme | Marks | Comments |
|---|---|---|
| (i) 10 | B1 | |
| (ii) 23 | B1 | Accept an answer in the range 22.5 to 23.5 (°F) |
| (iii) No with either 18(°C) is 64 to 65(°F) or 67(°F) is 19 to 20(°C) | B1 | Allow justification indicated on the graph. If both conversions are carried out then they must both be correct |
| (6) |