
Foundation June 2019 Paper 2 Q14
14.
(a) 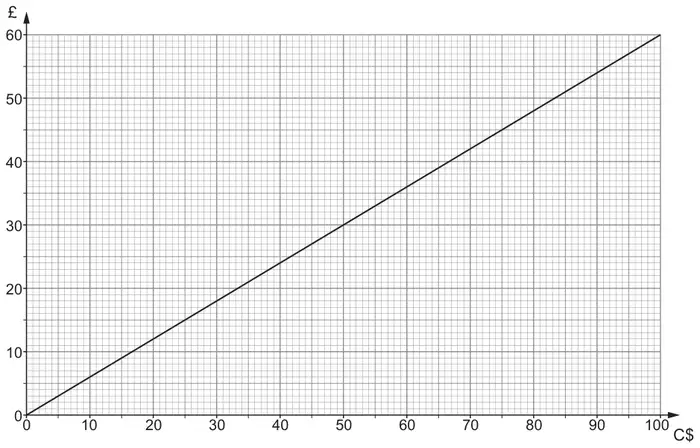
The graph below can be used to convert between Canadian dollars (C$) and pounds (£).
An exchange rate from 2018 has been used.
(i) Use the graph to convert C$ 50 into pounds (£). [1]
(ii) Use the graph to convert £25 into Canadian dollars (C$). [1]
(iii) Convert C$ 160 into pounds (£). [1]
(b)
In 1998 the exchange rate was £1 = C$ 2.44.
How many more Canadian dollars would you have received for £25 in 1998 compared with 2018? [2]
| Scheme | Marks | Comments |
|---|---|---|
| (i) (£)30 | B1 | |
| (ii) ($)42 | B1 | Answers in the range 41 - 42 |
| (iii) (£)96 | B1 |
| Scheme | Marks | Comments |
|---|---|---|
| (25 x 2.44 – ‘their 42’ = ) 19 | B2 | FT 'their (a)(ii)'. B1 for sight of 61 |
| (5) |