The number of students in each year of a school is shown in the table below.
Year group
Number of students
Angle
Year 7
90
Year 8
120
Year 9
135
Year 10
150
Year 11
105
Complete the table and draw a pie chart to display this information. [4]
(b)
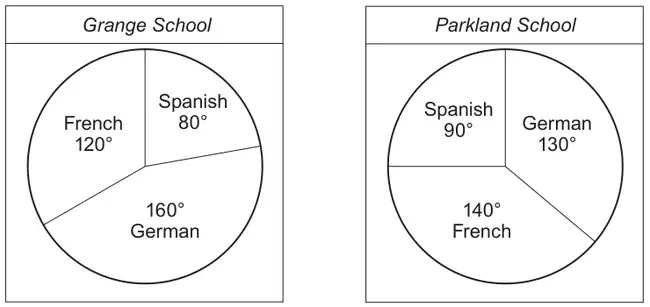
Two schools, Grange School and Parkland School each produce information leaflets. The pie charts below are from the different information leaflets. They show the proportions of students who study French, German and Spanish at these schools.
(i)
Is it true that twice as many students at Grange School study German than study Spanish?
Yes ☐ No ☐ Cannot tell ☐
Give a reason for your answer. [1]
(ii)
Is it true that more students study French at Parkland School than at Grange School?
Yes ☐ No ☐ Cannot tell ☐
Give a reason for your answer. [1]
(iii) At Grange School, 48 students study Spanish. Calculate the number of students who study French at Grange School. [2]
Mark scheme (a)
Scheme
Marks
Comments
All angles drawn correctly
Y7
Y8
Y9
Y10
Y11
54
72
81
90
63
B3
Allow tolerance of ±2\(^\circ\) for all angles, Allow B3 if 5th angle is outside this tolerance B2 for 3 angles drawn accurately or for all angles calculated correctly, OR B1 for 2 angles drawn accurately or for 3 or 4 angles calculated correctly.
All sectors labelled correctly
B1
Ignore any additional sectors created. SC2 for a pie chart with five correct sectors from their calculated angles, with labels correct. SC1 for a pie chart with 3 or 4 correct sectors from their calculated angles, with labels correct.
Mark scheme (b)
Scheme
Marks
Comments
(i) Indicates “yes” AND states or implies that the angle or area for German students is double that of Spanish. E.g. ‘160\(^{(\circ)}\) is 2 x 80\(^{(\circ)}\)’
E1
(ii) Indicates “Cannot tell” AND explains that we don’t know how many students are at the schools.
We'd like to use Google Analytics cookies to count visits and see which pages help most. They're optional, and the site works exactly the same either way. Privacy policy